

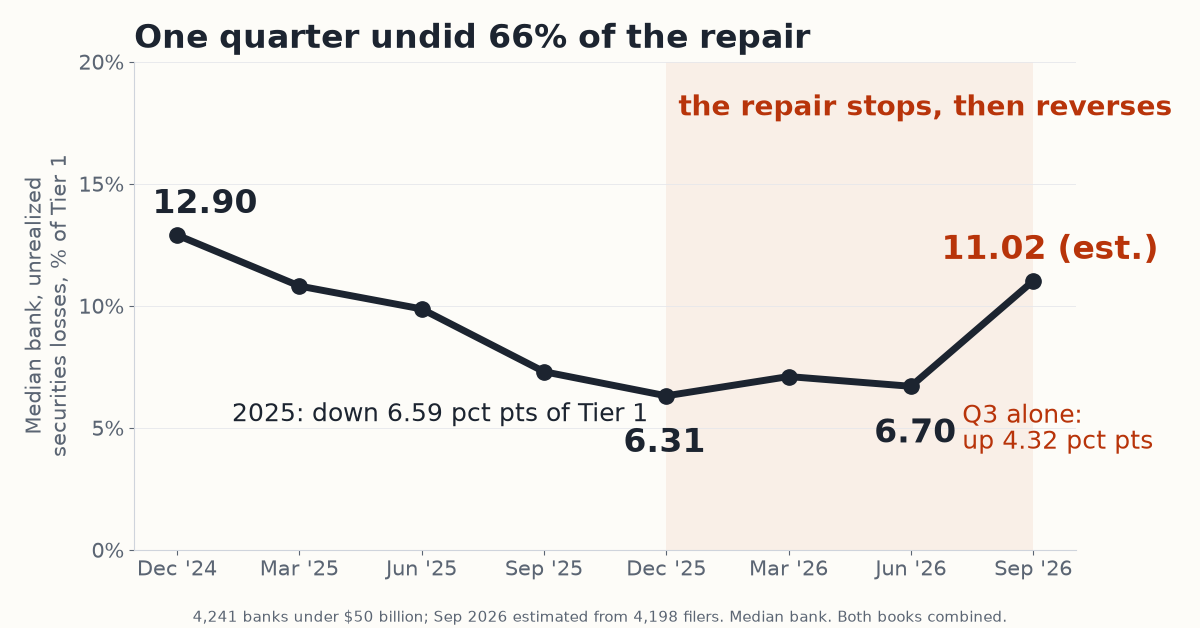
At banks under $50 billion, the median bank's unrealized bond losses went from 6.7 percent of Tier 1 capital in June to an estimated 11.0 percent in September. One quarter undid 66 percent of what 2025 repaired. Is that in your 2027 plan?
Most banks are building their 2027 plans now, and each one rests on a view of rates and what they do to the securities book. In September, in The Bond Repair Stopped Nine Months Ago, we showed that the 2025 repair had stalled at the December low. The September 30 Call Reports are now in from 4,198 of the 4,241 banks under $50 billion, about 99 percent of them by number and by assets, and they show it is no longer a stall. It is a reversal. Every bank's numbers are in a Q3 preview table, a standalone page for now, where you can check your own.
How Far Did Bank Bond Losses Move in Q3 2026?
At September 30, the median bank under $50 billion carried pretax unrealized losses on AFS and HTM securities of 11.02 percent of Tier 1 capital, a Statum estimate. At June 30 it was 6.70. At the December low it was 6.31.
That is the largest quarterly move of the eight quarter-ends shown, and it runs the wrong way. The 2025 repair began from a one-quarter jump at the end of 2024, from 9.8 to 12.9 percent, and losses remain well below their September 2022 peak of 23.3 percent. Across 2025 the median bank saw its losses shrink from 12.90 percent of Tier 1 to 6.31, a repair of 6.59 percentage points. The third quarter alone took back 4.32 points of Tier 1 of that, 66 percent. Counted from the December low, which adds a small drift in the first half of 2026, the median is up 4.71 points of Tier 1. For a bank of roughly $1 billion in assets with $100 million of Tier 1 capital, 4.32 percentage points is about $4.3 million more pretax unrealized loss in one quarter.
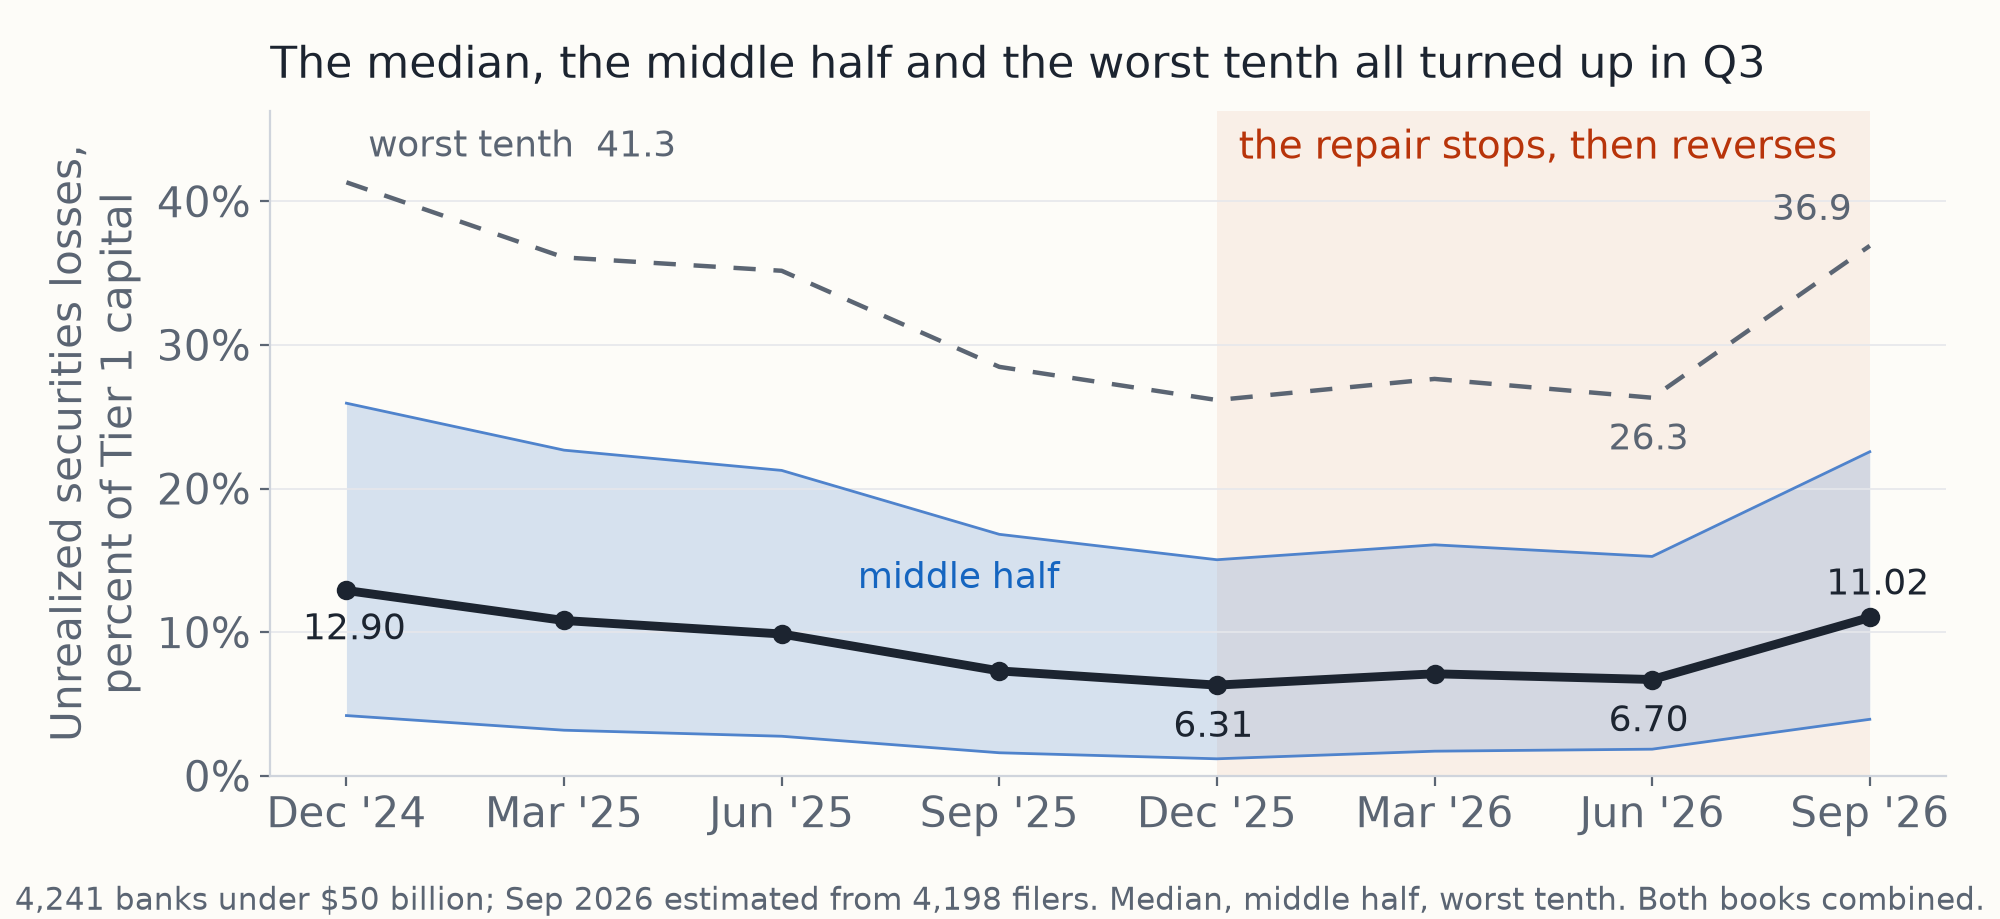
Figure 1. The median bank, the middle half of banks and the worst tenth, banks under $50 billion, eight quarters, both books combined. Computed from public Call Report and UBPR filings by Statum; September 2026 is a Statum estimate.
A stall leaves room in a plan. A reversal of this size changes it.
How Many Banks Are Worse Than in December 2025?
Most of them, and by real amounts. Of the 4,183 banks under $50 billion with all eight quarters on file, 3,401 are worse than at December 31, 2025 by more than a percentage point of their own Tier 1 capital (est.). In June there were 1,002. Counting any increase at all, 3,905 are worse, against 2,785 in June.
Among the 3,905 banks that are worse, the median one has lost 4.7 percentage points of Tier 1 since December (est.). In June the same measure was 0.7.
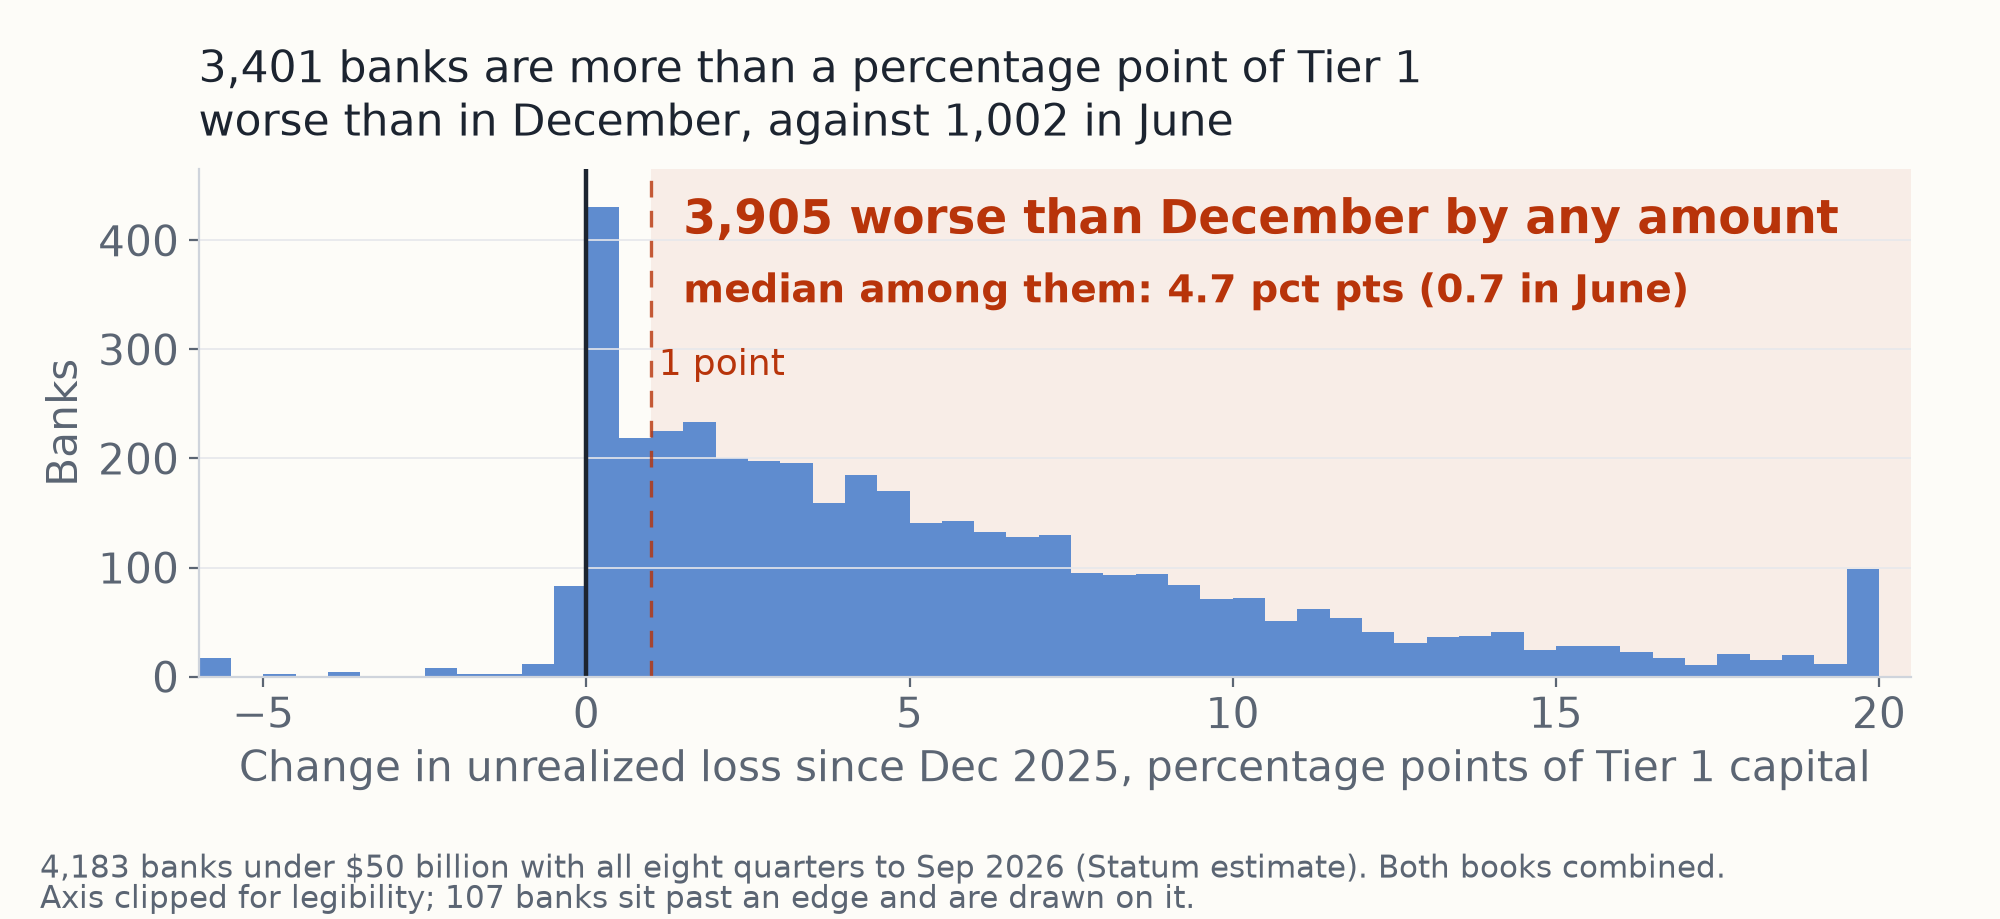
Figure 2. Every bank under $50 billion with all eight quarters, measured against its own December 2025 position. Positive is worse. Computed from public Call Report and UBPR filings by Statum; September 2026 is a Statum estimate.
On a linked-quarter basis, on Statum estimates, 3,960 of the 4,198 banks that have filed are worse than they were in June. The 90th-percentile bank moved from 26.3 percent of Tier 1 to 36.9.
Which Banks Are Boxed In by Losses and Funding Costs?
The September post drew a line at 15 cents of unrealized loss per dollar of Tier 1 capital. In June, 1,083 banks under $50 billion sat above it. Now, on Statum estimates, 1,695 do.
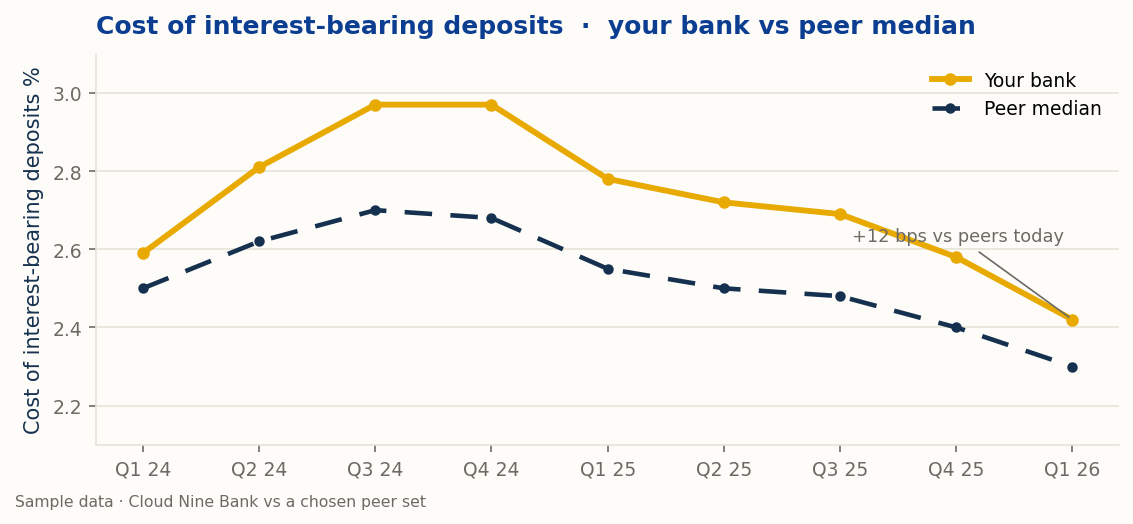
Since December 2024 the median bank's cost of all interest-bearing funds has fallen 34 basis points, with September on Statum estimates. Of the 1,695, 907 saw their cost of funds fall less than that, or rise. Measured the same way at June 30, there were 578. The Q3 preview table shows whether a bank is one of them.
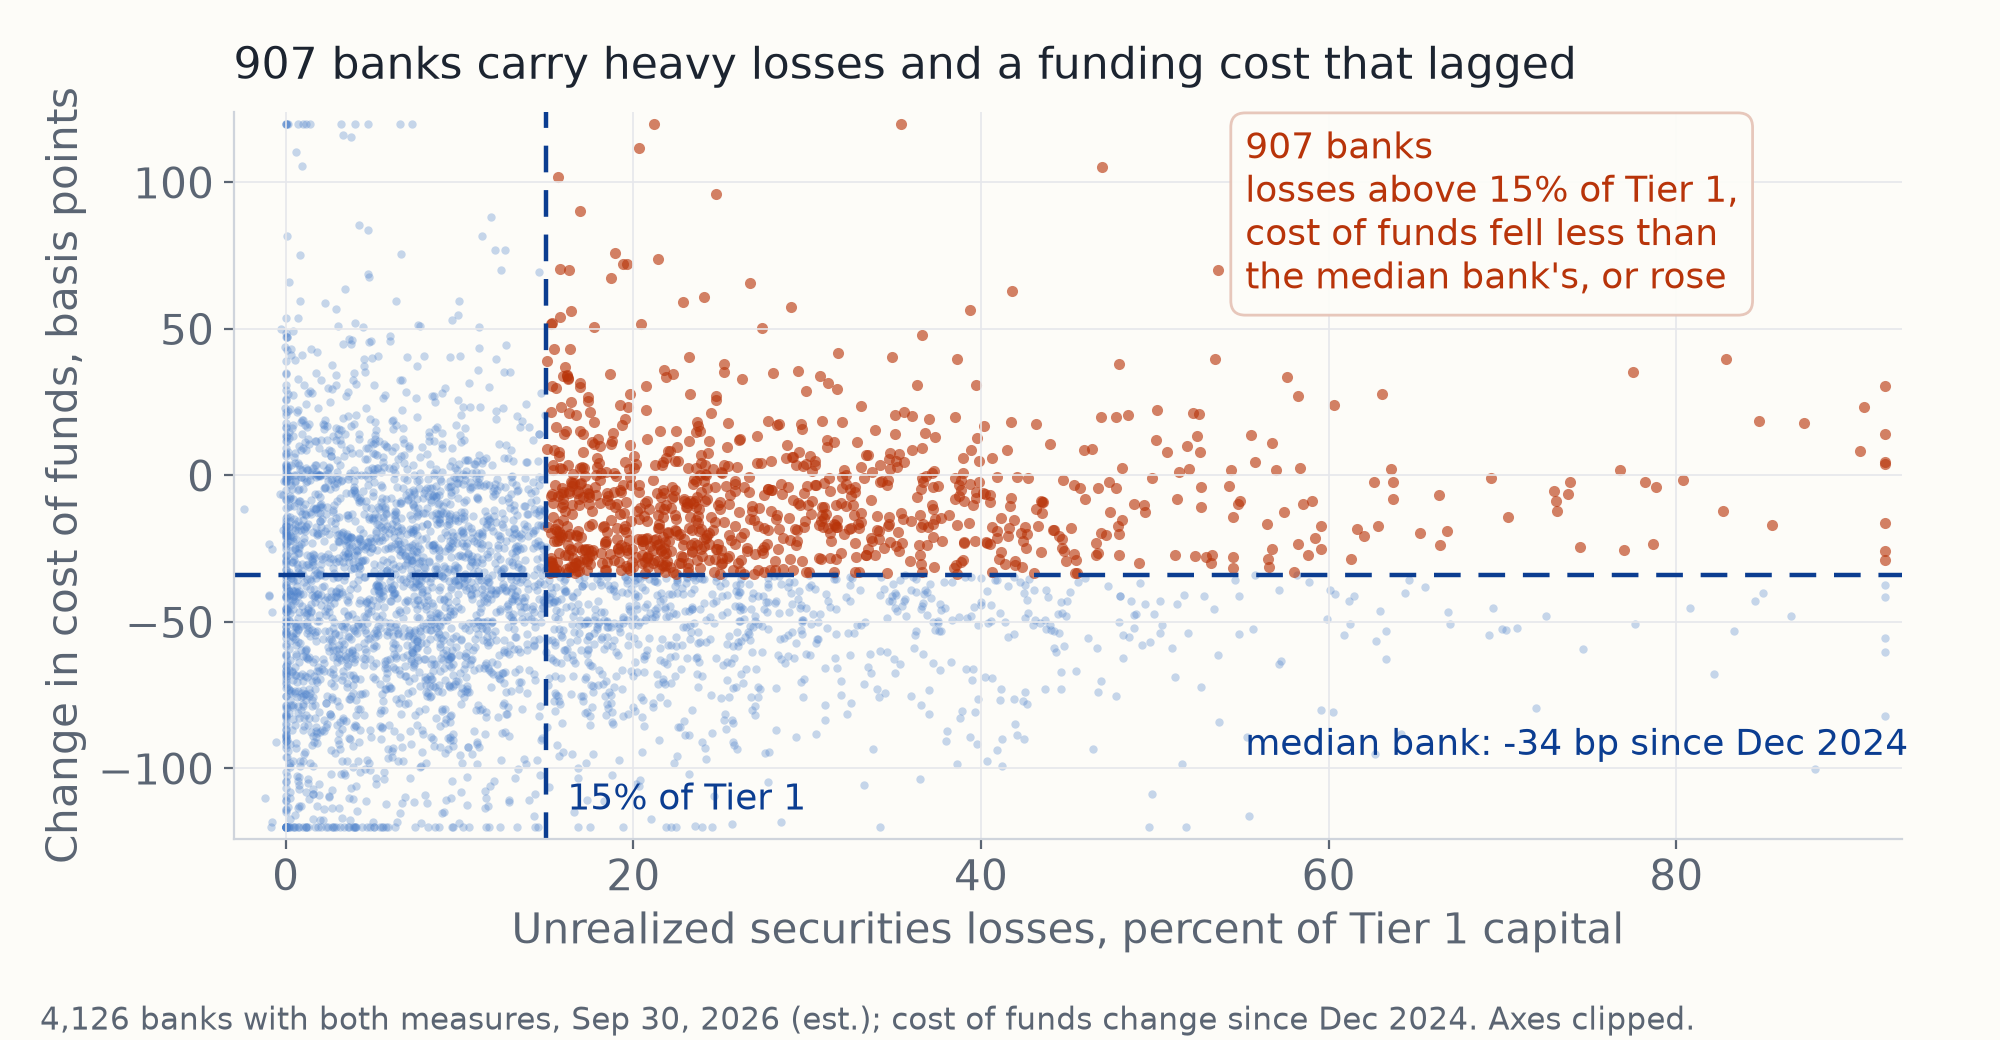
Figure 3. Each dot is one of the 4,126 banks under $50 billion with both measures. Right of the dashed line: losses above 15 percent of Tier 1. Above the dashed line: a cost of funds that fell less than the median bank's 34 basis points, or rose. Computed from public Call Report and UBPR filings by Statum; September 2026 is a Statum estimate.
For those banks the securities book is liquidity by pledge, not by sale: selling locks in a loss above 15 percent of Tier 1, and their cost of funds is repricing down more slowly than the median bank's. That combination is what turns a balance-sheet mark into a constraint on next year's plan.
It is a constraint on flexibility rather than on solvency. Banks that elected the AOCI opt-out leave these losses out of regulatory capital, and held-to-maturity marks never ran through it, though tangible common equity carries the AFS mark for every bank. The median Tier 1 leverage ratio of banks under $50 billion was 11.02 percent at June 30 and 11.17 percent at September 30, as filed, in the same quarter that community banks under $10 billion saw their unrealized losses on AFS and HTM securities together grow from $39.1 billion to $59.3 billion before tax.
Is Credit Piling Onto the Same Banks?
No, and that matters for how a bank reads its own position.
Credit is drifting the wrong way across community banks. Noncurrent loans reached 1.00 percent of loans at banks under $10 billion in the September Call Reports as filed, the highest of any quarter since at least March 2021. For the same group, the allowance for credit losses covered 130 percent of noncurrent loans at September 30, against 233 percent in September 2022.
But the deterioration is not concentrated in the banks under bond and funding pressure. Of the 907 banks above the 15 percent line whose funding cost lagged, 371 saw noncurrent loans rise in the third quarter: 41 percent. Across all banks under $50 billion the share was the same, 1,687 of 4,108, also 41 percent. Banks under bond and funding pressure are no more likely than other banks to show rising noncurrent loans.
That is why the industry number is a poor guide here. A bank can be fine on its securities book and slipping on credit, or the reverse, and the median will describe neither.
What Should a Bank Do Before the 2027 Plan Is Final?
Three things, and each starts from the bank's own line in the Q3 preview table. Look the bank up there first: its own eight quarters of unrealized loss, where it sits against the 15 percent line, how far its cost of funds has moved since December 2024 against the median bank's 34 basis points, and whether it is one of the 907 with both (the table calls that the two-risk corner).
First, measure the loss three ways and set the point where the bank acts. The table gives the size: the loss as a share of Tier 1 capital. Add time and capital. Time is the years of pretax income it would take to absorb the loss if the bank sold: on Statum estimates, 0.9 years for the median bank under $50 billion and 2.3 for the 907. Capital is tangible common equity with the held-to-maturity loss counted: 125 banks fall below 5 percent that way, 70 of them among the 907. Then name the rate level, or the years of income, at which the bank would restructure the portfolio, hedge or change its funding, and who brings that call to ALCO. For a bank in the two-risk corner, that level may already have been passed. If it has, it belongs on the November ALCO agenda, not in a plan that takes effect in January.
Second, make sure the securities book can raise cash without a sale. For a bank above the 15 percent line, the book is liquidity by pledge, not by sale: selling AFS securities turns a mark that the AOCI opt-out keeps out of regulatory capital into a realized loss that reduces it, and selling from HTM can taint the rest of the HTM book. Pledge the securities to the Federal Home Loan Bank and the Federal Reserve discount window now, test what they will lend against September market values after haircuts, and write that figure into the contingency funding plan.
Third, work the funding side. If the table shows the bank's cost of funds fell less than the median bank's 34 basis points, or rose, price the next dollar of funding against peers and reprice where the bank pays above them. Where the payback is short enough for the board, sell low-yielding bonds and reinvest. And read credit on its own: rising noncurrent loans were no more common among the 907 than across all banks under $50 billion, so the bank's own loan book, not its bond position, sets its reserve conversation.
Where to Look Up Your Own Bank
The September numbers for every bank, by name and with no signup, are in a Q3 preview table. The same page offers the full third-quarter report for banks under $50 billion to download: earnings, deposits, credit and capital, with the bond book by size band, earnings coverage and tangible capital, and size-band benchmarks for the ALCO package. The table lists all 4,292 banks in the UBPR universe; for the few that had not filed by November 2, including the largest, the line stops at June until they do.
The September ratios are Statum estimates until the FFIEC publishes the Q3 UBPR in mid-November. The preview table is a standalone page for now. It moves into Ask Statum with the third-quarter release on November 5, next to the June reading in Statum Acuity, the Ask Statum page on securities and funding pressure.
The filings show how far the losses moved, not why. That question belongs to each bank's own ALCO, and the advice from September still holds: no one outside the bank will set the trigger, so it has to live in the plan.
A note on method: this post covers the 4,241 banks in the UBPR universe of 4,292 with total assets under $50 billion at June 30, 2026. Every bank-level figure is a median or a count, never an average, because a few large balance sheets would dominate an average. Figures for banks under $10 billion as a group are their combined dollars, with ratios computed on those combined dollars. The counts rest on slightly different groups: 4,198 banks have filed for September, 4,183 have all eight quarters on file, 4,126 have both a loss figure and a cost of funds change, and 4,108 reported noncurrent loans in both June and September. Figures are from the Statum store of November 2, 2026 (estimate vintage estimate_engineG_20261102, 4,242 filers).
Amberoon builds Statum for community banks that want to read their securities book, funding and credit against every other bank, from the same public filings every bank already has. Statum output is an analytical tool, not financial, legal or regulatory advice.
Popular Posts
Last week the Federal Reserve did the one thing...

In February 2026, Anthropic ran a Claude Code...