

Accumulated losses shrank until December. Since then they have grown.
Two of every three banks in the country are carrying a bigger unrealized loss today than they were at the December trough. That is 2,859 of the 4,277 banks with a full seven quarters of filing history, and for 1,043 of them, one bank in four across the whole country, the increase is more than a full point of Tier 1 capital.
None of that made the news this week. The Fed raising rates on Wednesday did, and so did the CLARITY Act dying in the Senate on Tuesday, which leaves the rules on stablecoin deposit competition unsettled. Neither one should have been a surprise.
This is not a problem at the edges of the industry. It is most of the industry, and it shows up in the quarterly filings rather than in the news.
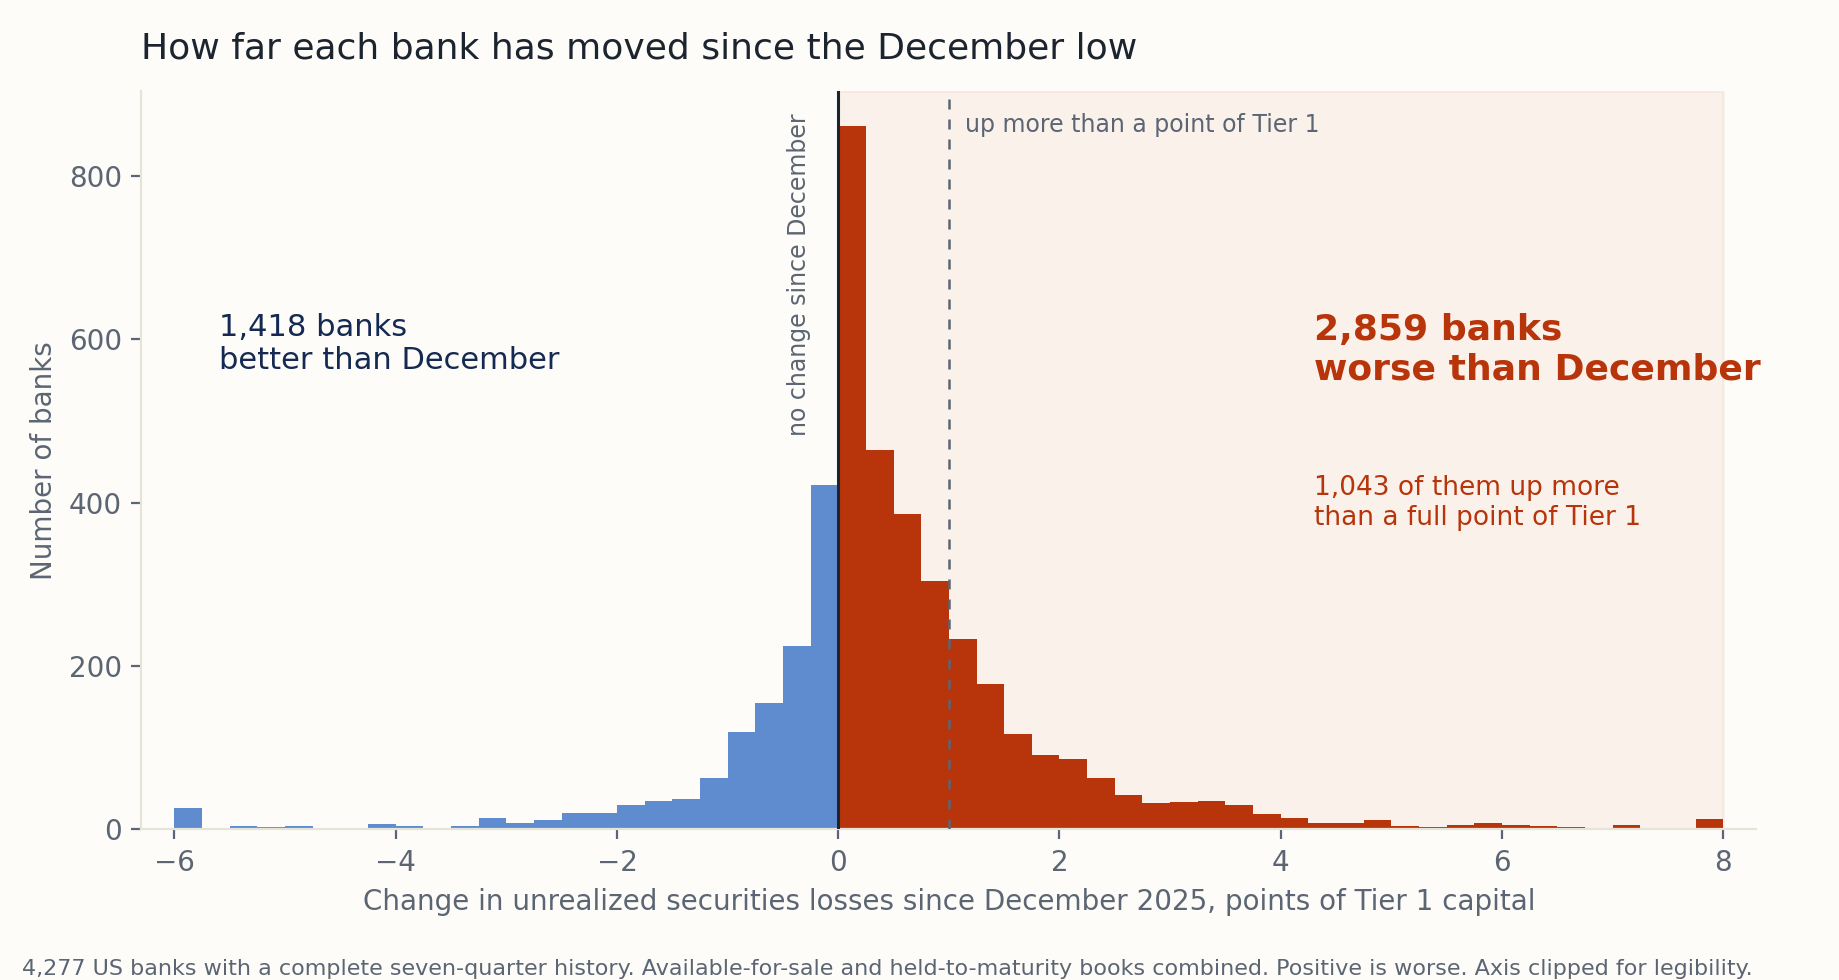
One of those 4,277 banks is yours. Look it up by name, no signup.
Three things changed this year, and all of them preceded the events in Washington this week. Bond losses had been shrinking all through 2025, and that stopped in December, nine months ago. The stablecoin gap in bank deposits opened fourteen months ago and is still open. Forward guidance ended three months ago at the Fed's June meeting. Wednesday was the last of these, not the first.
In the next six weeks most banks will build a 2027 plan. The standard method, and the right one in a stable year, starts from last year's numbers and adjusts. This was not a stable year, and those numbers were set before any of this. For community banks deep into budget planning for 2027, neither Wednesday's rate rise nor Tuesday's vote should have a disproportionate impact on that plan. The three changes above should.
Building the plan properly now takes three steps: work out what is coming, identify what has already happened, and decide what to do on Monday morning. Those are the three operating principles behind Amberoon Statum KPI: see the future, read the past, run the present.
See the future
Start with what nobody can do, and that is tell you where rates go in 2027. The Fed has stopped trying. At Jackson Hole in August, Chair Warsh said forward guidance "has overstayed its welcome." At his July press conference he put it in fewer words: market participants "are learning to play the ball, not the referee." He was not apologizing. He called it "a change for the better," and added, "we're just getting started."
The 2026 plan could open with a sentence about where the Fed had signaled it was going. The 2027 plan cannot, because there is no signal left to quote. What the Chairman offered in its place was this: market participants "should draw their own conclusions; form their own expectations of output, employment, and inflation; and stay sharply attuned to risks."
That is not a gap in the guidance. That is the guidance.
So seeing the future is projection from filings that already exist. The Amberoon Statum suite offers a range of capabilities to pinpoint this intelligence. Amberoon Statum KPI scores six components of capital, efficiency and earnings against all 4,292 banks and ranks where a bank is heading eighteen months out. The Statum GPA averages those six into a letter. The Statum Variability Index (SVI) says how much to trust that letter, because some banks hold their position and some do not.
A forecast only knows what it was built to look at. Our newest offering, Statum Acuity, asks the question a forecast cannot: how rare is what this bank just filed? Every filed value is scored for surprise three ways at once, against every other bank, against the bank's own seven quarters, and against banks that look otherwise identical on size, structure and business mix. The Statum Acuity Index runs 0 to 100 and is the share of banks whose quarter was less surprising.
Unusual never means troubled. Most quarters are ordinary, 3,219 of the 4,292, and a high score is a description rather than a warning.
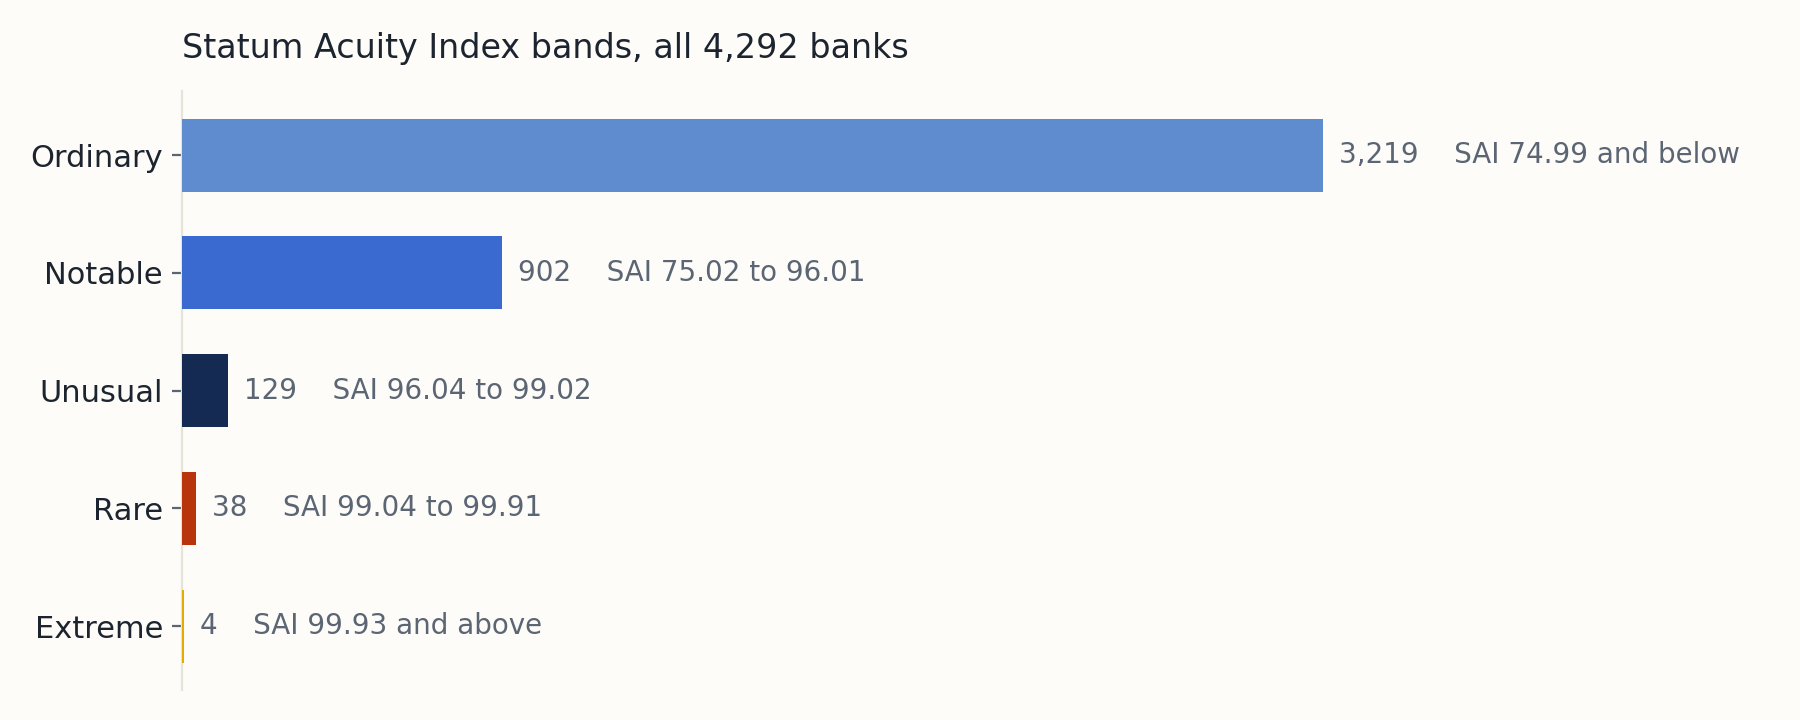
The two readings are independent. Across the 4,228 banks carrying both, the Acuity Index and the Statum GPA have a rank correlation of minus 0.06, which is 0.4 percent of the variation in either. Most unusual banks are unusual by design rather than by distress: card issuers, brokerage banks, branchless lenders. Ninety banks sit at the unusual end of the index, carry a weak grade, and are moving the wrong way, all three at once. That is one bank in 48, and it is the only combination where rarity and weakness point at the same thing.
Read the past
The median US bank carries unrealized securities losses of 6.79 percent of Tier 1 capital, about 7 cents of every capital dollar. None of that reduces regulatory capital: most banks elected out of AOCI, and held-to-maturity marks never ran through it. What a mark this size does is take the securities book off the table as a source of liquidity, because selling means realizing. It is a constraint on flexibility rather than on solvency, and it is the one that binds when funding gets expensive.
Read the seven quarters in order: 12.96, then 10.86, 9.93, 7.38, and 6.38 at the end of 2025, then 7.17 in March and 6.79 in June.
December was the bottom, and at the time it did not look like one. It looked like a fifth consecutive quarter of repair. March came in worse. June took part of that back and stayed above the December low, leaving the median 0.41 points above the trough. Measured against June 2025 the year still reads well, with 3,807 of the 4,277 better off and the median bank 2.69 points of Tier 1 better. What stopped was the improving. The repair ran at 1.64 points a quarter for four quarters; on that pace the median would be near 3 percent of Tier 1 today. It is 6.79, and the plan being written this month assumes the pace that stopped.
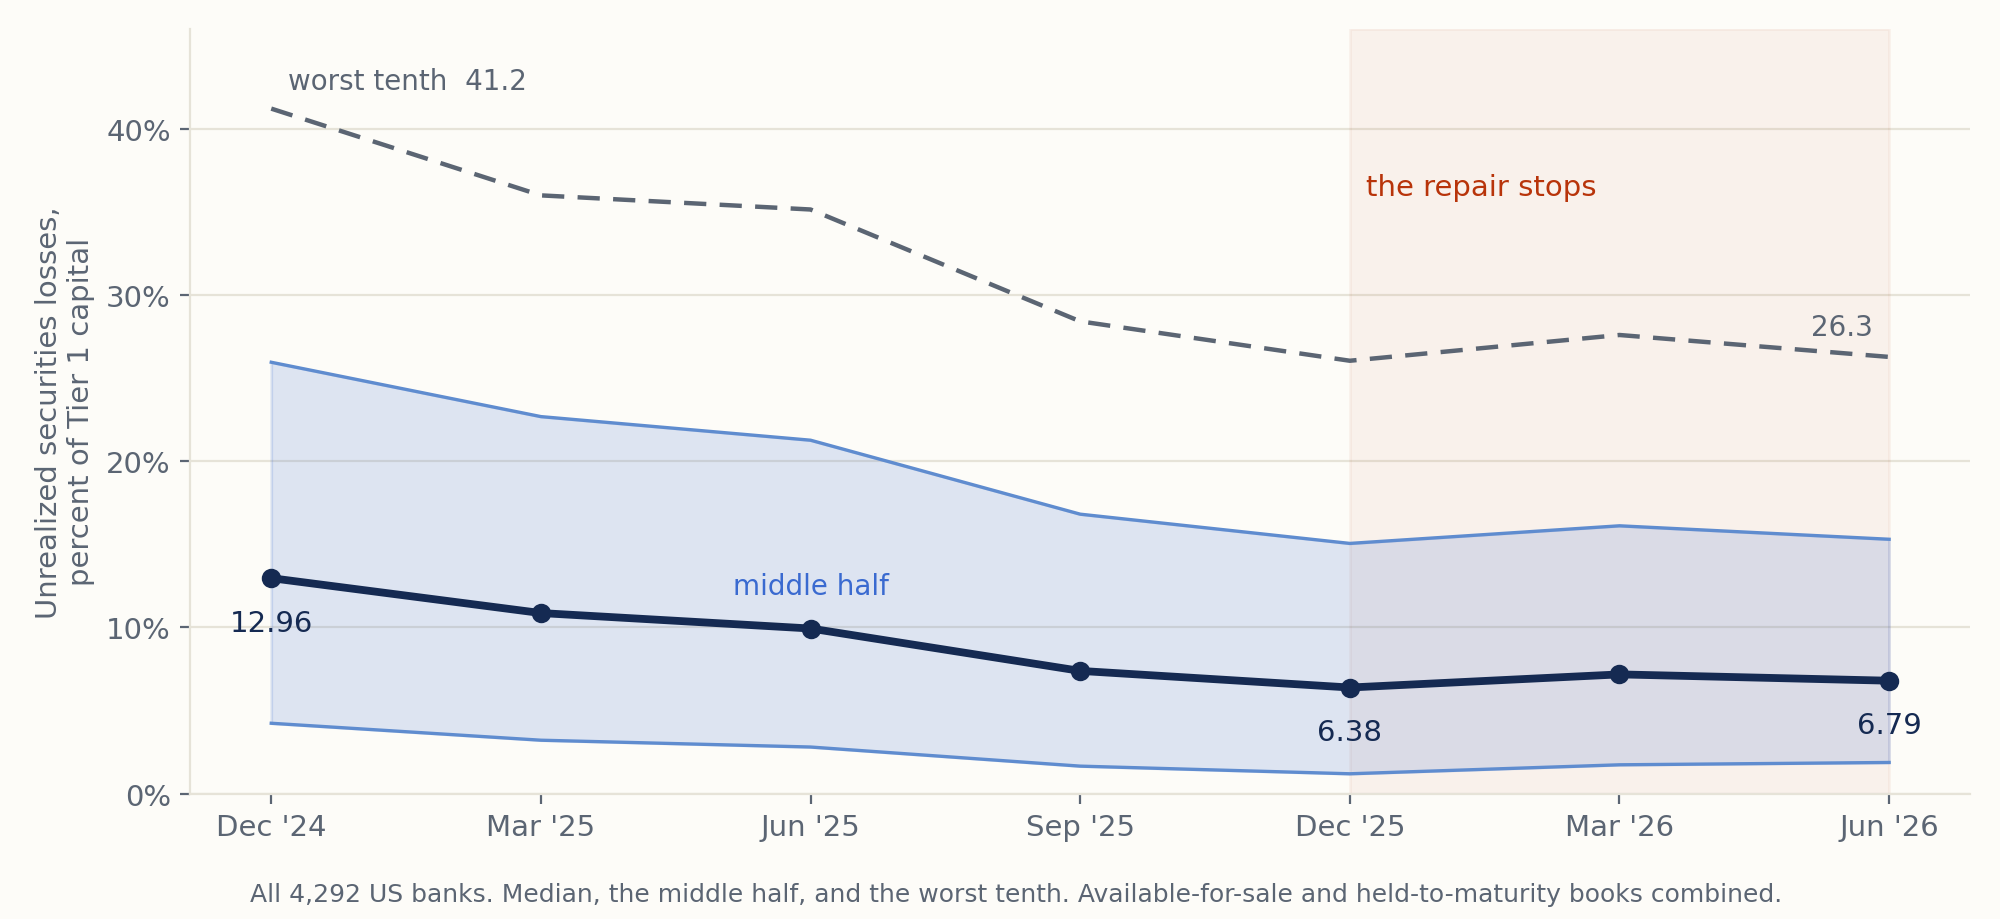
Every figure here is a median, never an industry average. Nine banks hold 52.5 percent of all assets, so an average mostly tells you about them.
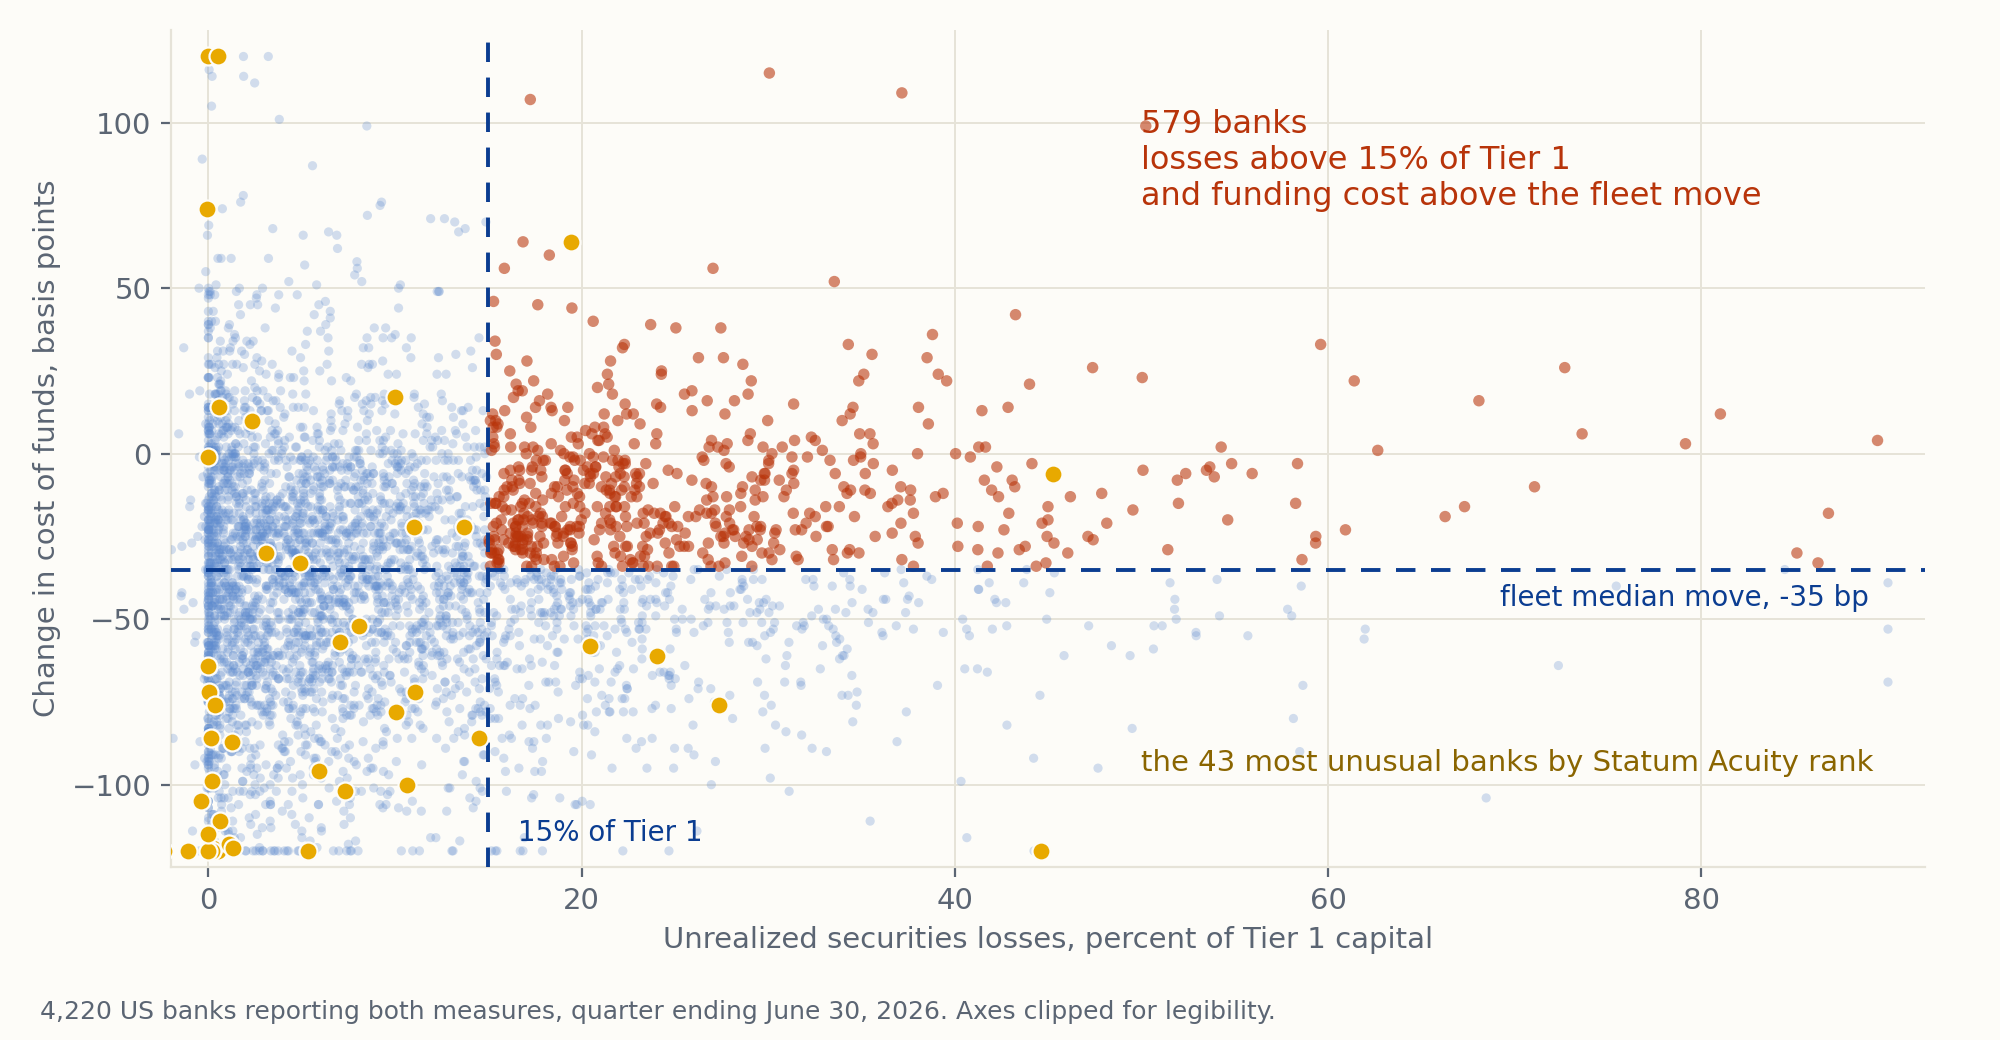
Inside the two thirds, the distinctions matter for planning. For 519 banks the losses deepened in at least three of the last six quarters, which is a trend rather than a bounce off one bad mark. Separately, 1,099 carry more than 15 cents of loss per capital dollar, whatever direction they are moving. Only 95 are in both groups, because a heavy mark and a worsening one are different problems.
Of those 1,099, some 579 are also paying up for money, with a funding cost running above the move the rest of the fleet made. They sit in the upper right below, and a rate rise pushes both of their axes at once.
Run the present
The national number is no help in deciding what to do. Look at what deposits actually cost this quarter and the answer runs with size. Among the nine largest banks in the country, 77.8 percent paid more for deposits than the quarter before, and the median one paid 3.11 basis points more. Among the 3,238 banks under a billion dollars, 47.3 percent paid more, and the median one paid a third of a basis point less. Those are two markets, and the industry average sits between them describing neither.
Size is not the end of it. Group the same banks by how they actually compete and the verdict moves. Statum Peer Cohorts sort 4,208 banks into 61 groups on charter type and business model first, with region and size used only to separate banks that already share a model. A deposit-platform lender is measured against deposit-platform lenders rather than against the community bank down the road that happens to hold the same assets. Across the 3,778 banks carrying both a Statum Peer Cohort and a UBPR peer group, the median gap between the two verdicts on cost of funds is five percentile points. For 325 of them, one bank in twelve, the two land in opposite halves: the size bucket puts you in the better half and the banks you actually compete with put you in the worse one, or the reverse. Fifty of those also sit in the quadrant above.
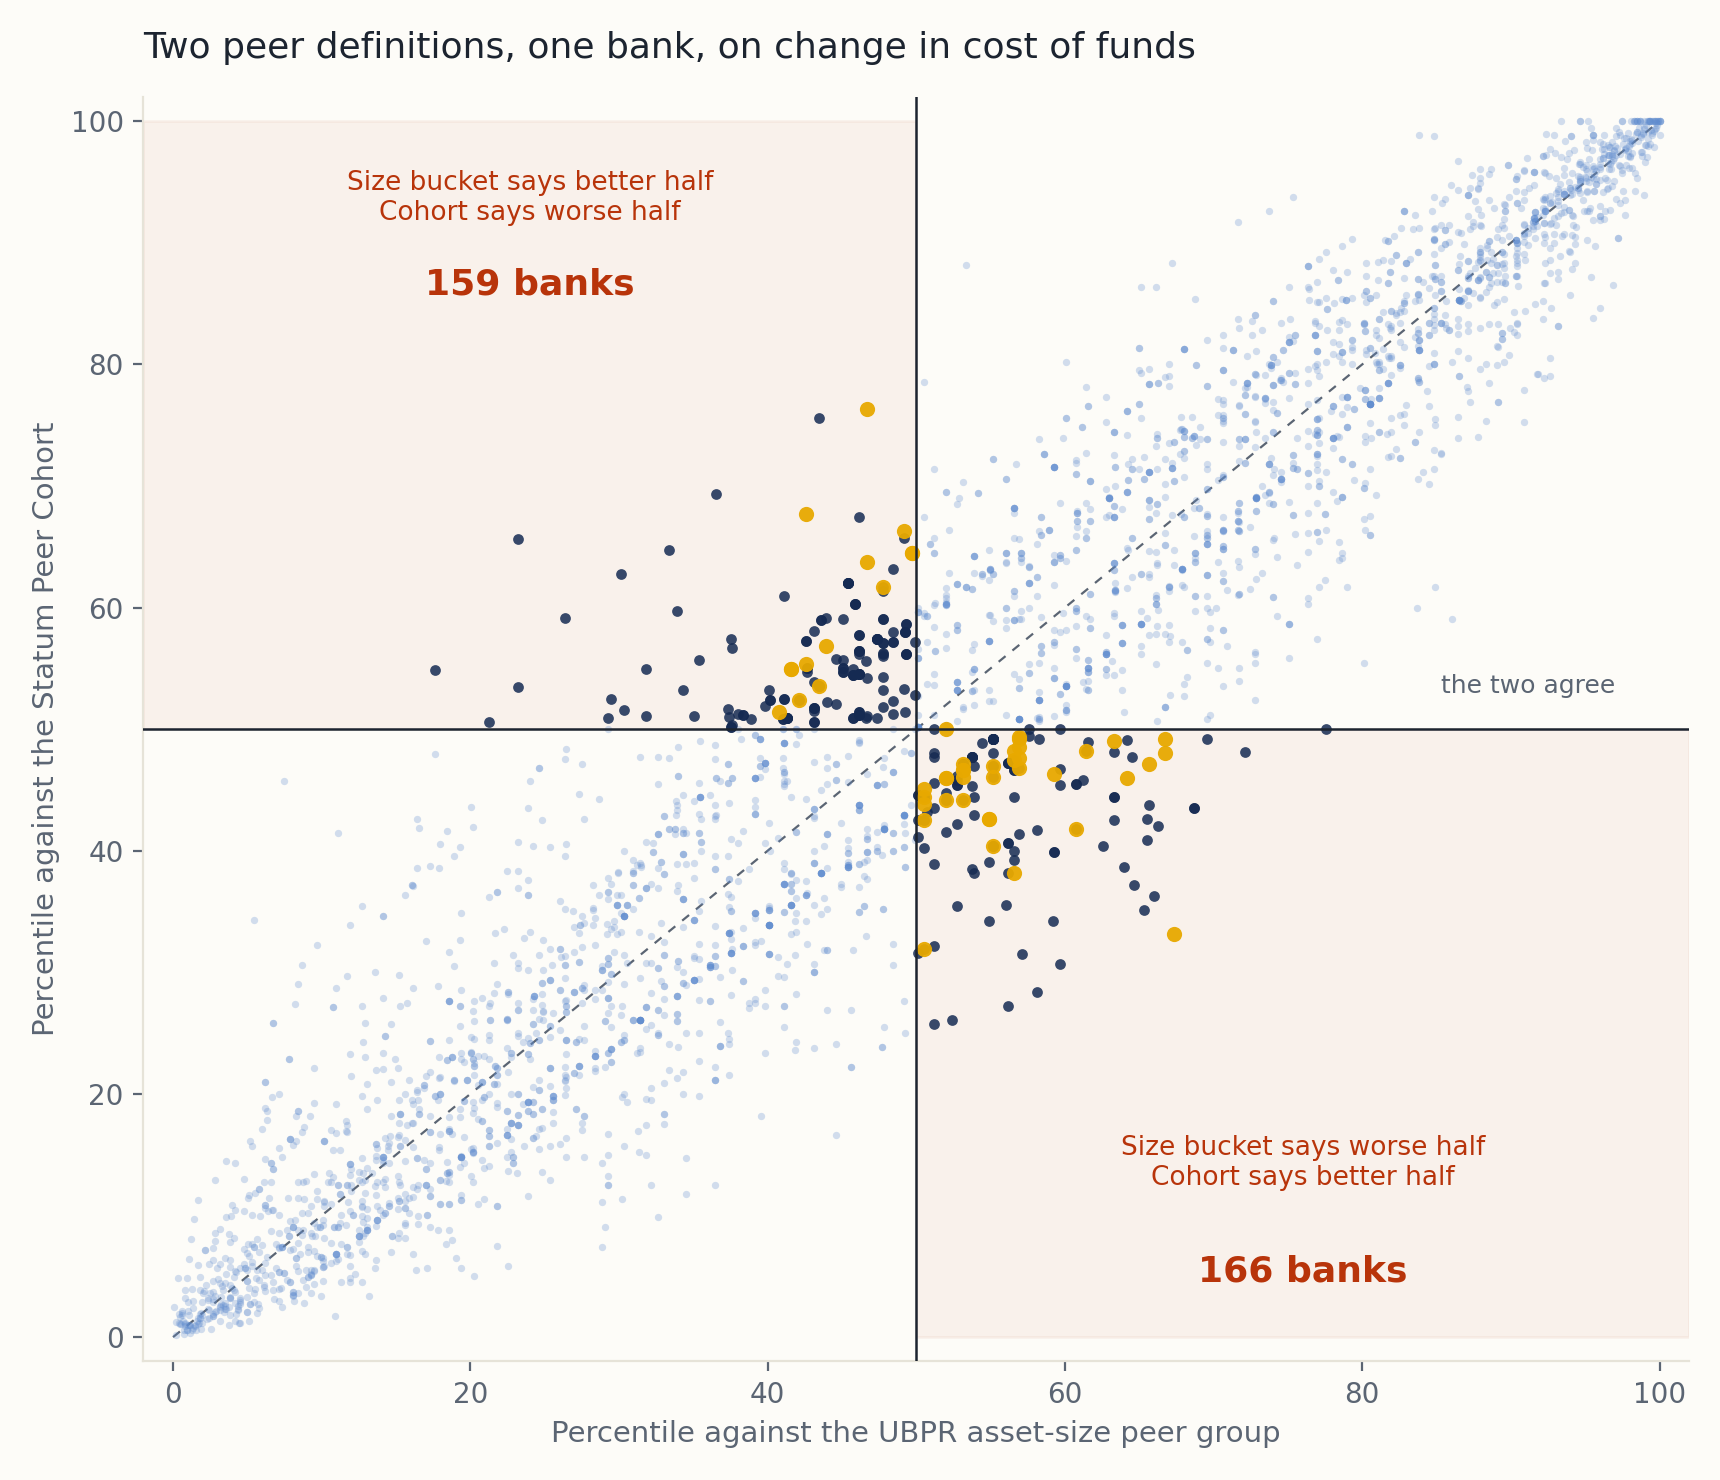
Which of the two you are is not something your own filings can tell you, because the answer lives in the other 4,291. A plan built on the wrong verdict is not a cautious plan. It is a confident plan pointed at the wrong problem.
Nobody is going to settle the deposit question for you either. The GENIUS Act has been law since July 2025 and bans yield paid by a stablecoin issuer while saying nothing about yield paid by the platform that holds the coin; the CLARITY Act would have closed that and failed 49 to 50 on Tuesday. Coinbase pays 3.75 percent on USDC balances to its Coinbase One members, for $4.99 a month. That competition is not waiting for Congress.
Banks had asked Congress to ban platforms from paying those rewards. On the day of the vote the White House Council of Economic Advisers priced the ban: total bank lending would rise by 0.02 percent, about $2.1 billion, of which community banks would take $0.5 billion. Across the four thousand banks under $10 billion that is roughly $125,000 each of lending capacity, worth about $7,500 a year at a 6 percent yield. That is the administration's own number for what waiting on Washington is worth.
So here is Monday morning. Three things, and the second is the one you cannot do alone.
Pull your unrealized securities loss as a percentage of Tier 1 for the last seven quarters, both books together, put your cost of funds beside it, and read the shape rather than the level. If the loss bottomed in December and has drifted up since, you moved with the industry. If it never bottomed, you are in the 519. Losses deepening while funding costs climb is two risks with one cause, and it belongs on the October ALCO agenda, not the January one.
Then find out which peer group you are actually in. If your real competitors carry less exposure than you do, the defense belongs in next year's deposit budget now. If they carry more, their best customers are reachable. It is the one step on this list your own filings cannot answer, and it is worth taking to the data.
Then put one number in the 2027 plan that is not a forecast. Name the rate level at which holding the duration position stops being a choice and becomes a decision, write it down, and give it an owner. There is no forward guidance coming, so the trigger has to live in your plan.
None of this came from a forecast. It came from reading what 4,292 banks filed, one bank at a time, across seven quarters, and putting each one beside all the others. That is a different exercise from reading your own call report carefully, and it is the only way to learn that two banks in three moved the way you did.
Rates turned on Wednesday. The filings turned in December. One of those you could have read nine months ago, and next year's plan is the last place it still matters.
Three numbers your bank already has and probably has not seen side by side: how far its unrealized loss has moved since the December low, how rare this quarter's filing was against the other 4,291 banks, and whether those two readings point the same way. All three, for your bank by name, with no signup, at askstatum.amberoon.com/one-storm
Statum output is an analytical tool, not financial, legal or regulatory advice.
Popular Posts
Last week the Federal Reserve did the one thing...

In February 2026, Anthropic ran a Claude Code...