

In 1950 the Air Force Found That Its Cockpit Fit Nobody
In the late 1940s, with the war won, the US Air Force had a great deal to celebrate and one very dark spot. Its planes were falling out of the sky at an appalling rate, 17 of them on the worst single day. This obviously was not enemy gunfire, so the Air Force blamed the planes, then the training, then the pilots, and none of it held.
In 1950 it took an analytical approach instead, sending a young lieutenant named Gilbert Daniels to Wright Air Force Base to remeasure the cockpit, which had been designed in the 1920s around the average pilot. Daniels measured 4,063 pilots on ten bodily dimensions and counted how many sat in the middle range on all ten. The answer was exactly zero. Not one man out of 4,063. The cockpit had been built with great precision for a person who did not exist, and the men flying it were paying the difference.
Daniels had found what statisticians call the flaw of averages: design to the middle of a population and you fit nobody in it.
Three quarters of a century later there is a striking parallel. There were 4,063 pilots then. There are 4,291 banks in the United States today, and the asset-weighted industry average they are benchmarked against fits about as many of them. It is 3.21 percent for Q2 2026, and four out of five banks beat it. Banks do not fall out of the sky. They disappear quietly, absorbed in a merger after a few quarters of margin compression, and nobody files an accident report.
The 3 Things That Changed: Rate Direction, Fed Guidance, Your 2027 Plan
Three inputs to next year's plan changed this summer, and all three moved the same way: away from anything you can look up.
- Rate direction. Last year it was one path, downward. Now it is open: on July 29 the FOMC held at 3.50 to 3.75 percent, and Beth Hammack, Neel Kashkari and Lorie Logan each voted to hike.
- Fed guidance. Last year it was published, and reliable enough to plan against. Now it is withdrawn: Federal Reserve chair Kevin Warsh has retired forward guidance, so any forward view has to be built, not read.
- Your 2027 plan. Last year it was built to one rate path. Now it has to hold whether the next move is a cut, a hold or a hike.
Warsh was explicit about it at the July press conference: "By not spoon-feeding markets, by not previewing our decisions, by not sort of giving nudges and leans." He did say that any central banker who "sees underlying inflation moving higher is more inclined to tighten policy." Inflation remains elevated and three colleagues already voted to raise. The arithmetic is not hard.
So do not plan off the headlines. Warsh will not tell you, and what Bank of America does with its deposits has nothing to do with your market. The largest banks moved first this quarter. Community banks reprice slowly and take some runoff at the edges. Average the two and you get a number that describes neither. That is the flaw of averages, and in a turning cycle it costs real money.
Plan off the data instead, and the richest data you have is your peers'. Community banks are the first mile of banking, where a loan gets made because somebody knows the borrower, and the first mile prices on its own terms. Your seven closest competitors, the ones your lenders can name without looking, file every quarter. That gives you three things the industry number never will.
- What they did. How each one repriced the last three times funding costs turned.
- What they are doing now. Cost of deposits, loan yield, funding mix and margin, this quarter.
- Where they are going. The Fed stopped publishing a forward view, but a bank's filings support one, so your seven can be planned against on where they are heading and not only on where they have been.A forecast built that way covers all 4,291 banks instead of one policy path. Work outward from there: your seven, then your Statum Peer Cohort, then the UBPR group the examiner opens, then the industry for context.
What Did a Typical Bank Earn in Q2 2026? Four Answers, and the Industry Figure Is 60 bps Low
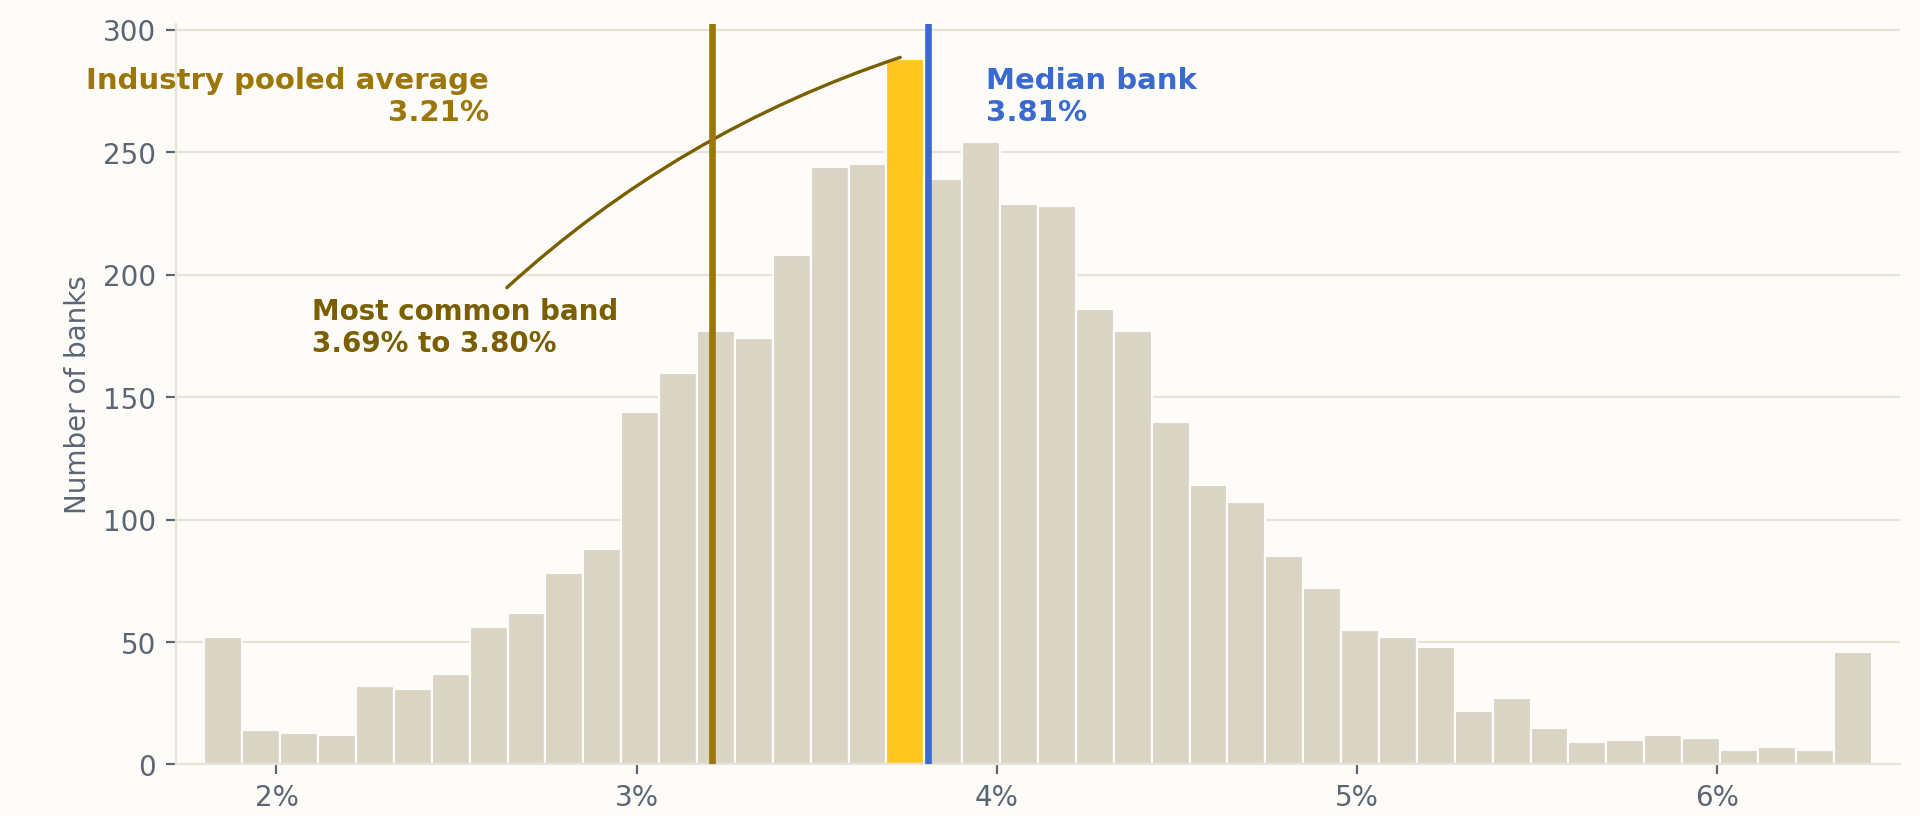
Ask what a typical American bank earned on net interest margin last quarter. Of the 4,291 banks, 4,273 filed a usable margin figure, and those same 4,273 filings give four different answers, all of them arithmetically correct.
- Industry figure, asset-weighted: 3.21%
- Most common band, where the pile of banks sits: 3.69% to 3.80%
- Median bank, the one in the middle: 3.81%
- Equal-weighted average, every bank counts once: 3.85%
Sixty basis points separate the industry figure from the median bank. That is the answer, and it is the whole problem. The industry figure is the first row, it is the one that reaches your board, and it is the only one of the four not describing a bank. The other three sit within 16 basis points of each other. It sits 60 below because it is asset weighted, and 50 banks hold more than three quarters of all US bank assets. On a $500 million bank, with earning assets at 96 percent of assets, that is about $2.9 million of pretax income a year, so which benchmark sits in the board pack is not a rounding question.
Say your bank earns 3.40 percent. Against the industry figure you are 19 basis points ahead. Against the median bank you are 41 behind. Same filing, same quarter, and a 60 basis point swing in where you stand, decided by which comparison you picked. Plenty of ALCO packs already carry a median for exactly this reason. The harder question is which banks belong in it.
Every figure here is computed from Call Reports filed by August 4 and run through one engine. The FDIC's own Q2 2026 Quarterly Banking Profile does not publish until September, so these numbers run ahead of the public aggregate rather than restating it. On Q1 2026 the same engine reproduced the FDIC's published 3.31 percent to within eight basis points, at 3.23.
This is not a complaint about the FDIC. Its own researchers made the point first. A 2021 article in the FDIC Quarterly used a median instead, and said why in a footnote on page 33: "much previous analysis has been based on the industry-weighted average NIM, which is influenced by the largest banks." The Quarterly Banking Profile still publishes weighted averages, which is the right choice for describing the system and the wrong one for describing your bank.
Are Bank Deposit Costs Rising or Falling in Q2 2026? Both, Depending on Your Bank
Deposit costs in Q2 2026 rose in four asset tiers and edged down in one, and the split runs by size.
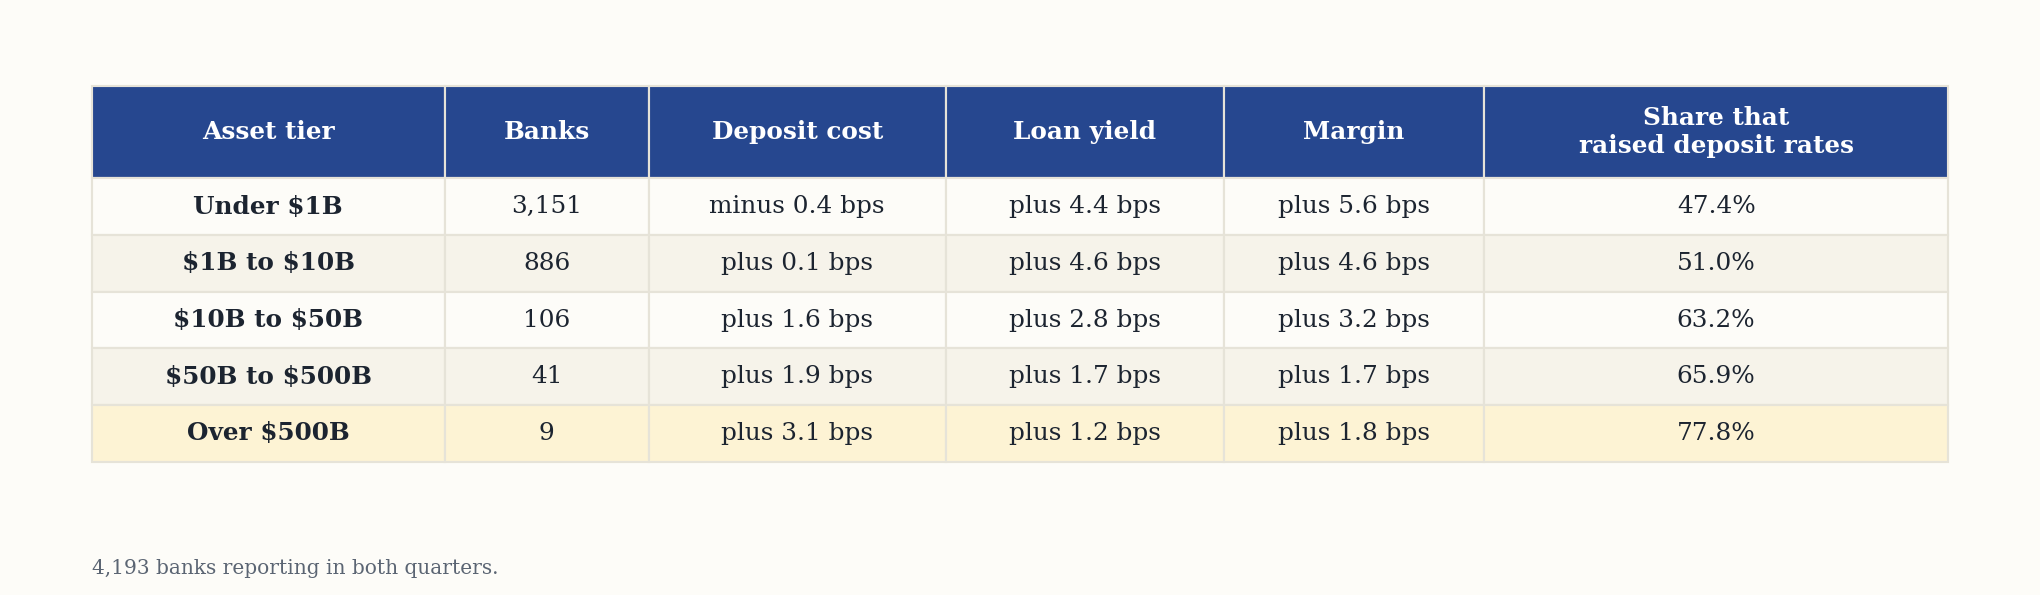
The turn in funding costs has arrived at the top of the industry and has not reached the bottom. Loan yields rose in every tier, so the difference between tiers is not an asset story. It is a funding story.
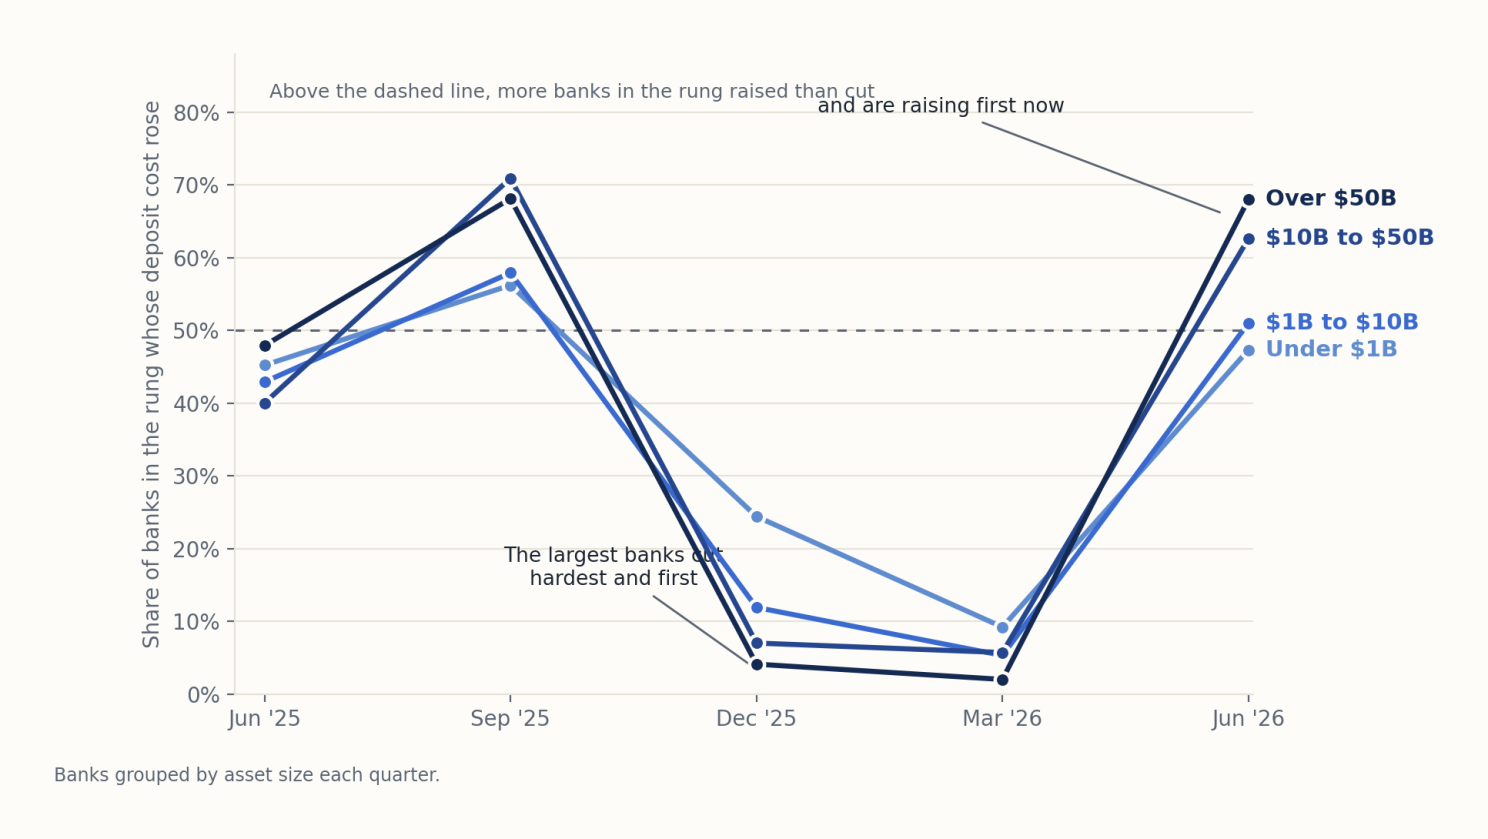
That order is not a one-quarter accident. In December 2025 only 4 percent of banks over $50B were raising deposit rates, against 24 percent of banks under $1B. By June 2026 that had inverted, with two thirds of the largest raising against under half of the smallest.
When the top tier turns you have a quarter or two before it reaches you, which is time to reprice rather than react. Use it as a pattern, not a model: nine banks make up that tier, so one institution moves the line by eleven percentage points. An industry deposit beta in your 2027 forecast is mostly describing those nine.
Which Peer Group Should Your Bank Benchmark Against? All Four, in This Order
- Your seven. Grouped by the banks actually bidding for your deposits. You build it, from what your lenders already know.
- Statum Peer Cohort. Grouped by location and asset size together. Amberoon computes it.
- UBPR peer group. Grouped by asset size alone, as of February 2026. The FFIEC assigns it to you.
- The whole industry. Every bank, asset-weighted. The FDIC publishes it.
None of this is a new idea. Bank Director was asking these questions in 2018, the ICBA has been making the case since 2021, and the FFIEC ships a free Custom Peer Group Bank Report that will build a group for you. Start there. Three things it cannot do are the reason this section has four rows and not one.
Start with your seven, and do not start at the top of the building. Your lenders and branch managers already know the names: the bank two counties over that just opened in your best market, the credit union taking your commercial balances, the online bank with no branches at all.
Seven banks cannot settle every question, so the Statum Peer Cohort widens it to banks your size in your location and drops the ones that break comparison outright: the custody houses, the card lenders, the banker's banks. The UBPR group comes third, because asset size alone tells you about the tide rather than the boat. Open it anyway, because the examiner will.
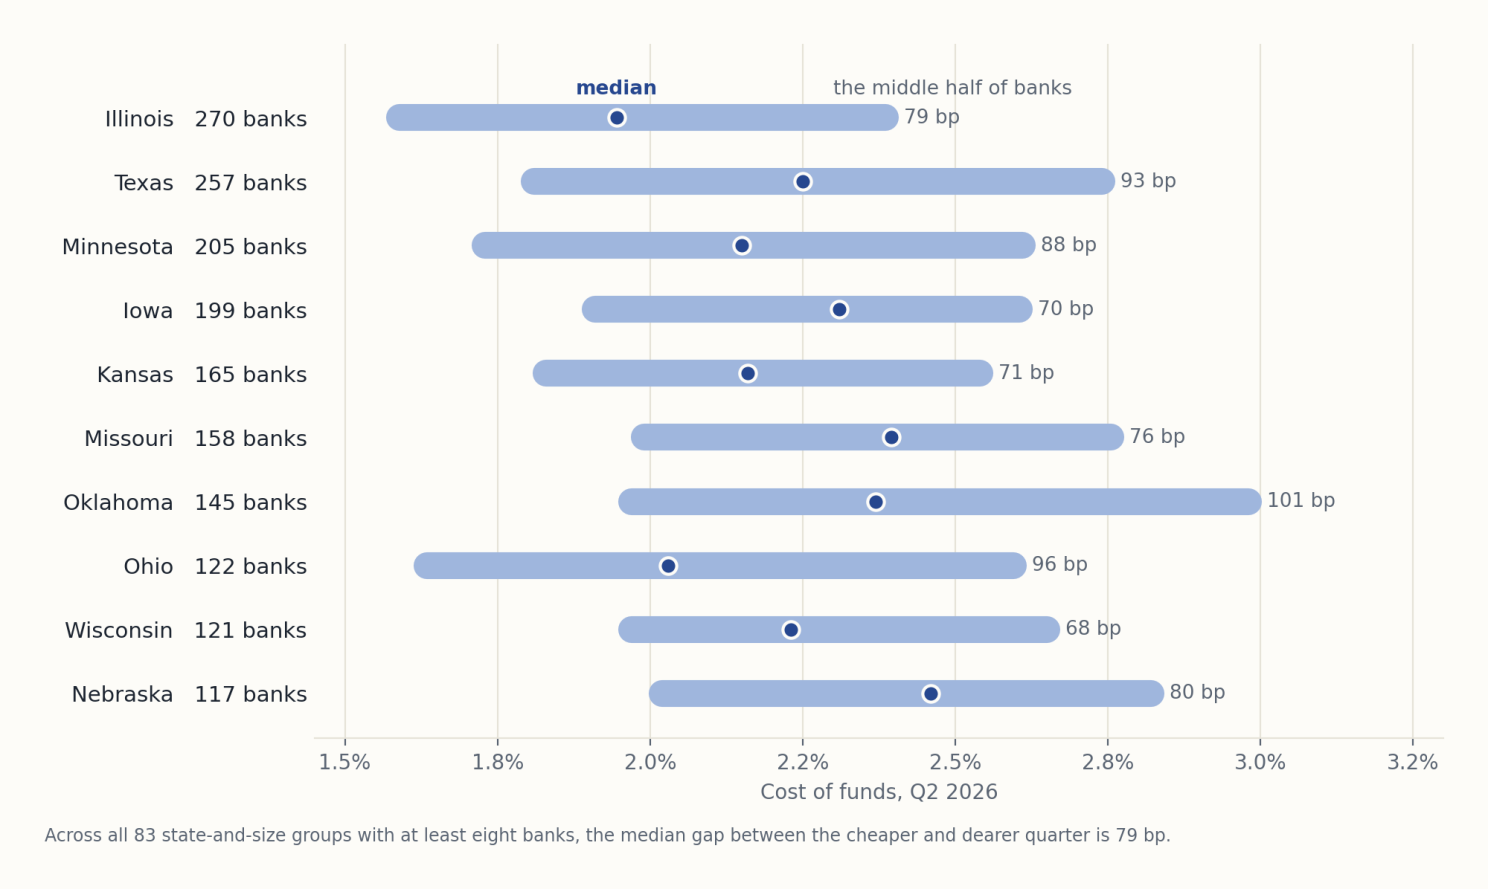
Take the 270 banks under $1B in Illinois. The middle half pay between 1.6 and 2.4 percent for funding, a spread of 79 basis points, and Illinois is the tightest of the ten largest state groups. In Oklahoma the gap is 101. That spread is the range you compete inside, not money on a table: no bank moves a whole deposit book from the expensive quartile to the cheap one without losing balances. But it sizes the question. On a $500 million bank, with deposits at 86 percent of assets, 79 basis points is about $3.4 million a year, roughly 25 times the largest move any asset tier made this quarter. Where you sit in that range is worth more to know than the industry average, and if you price against banks that are not competing for your balances you find out in the margin a quarter later.
Run all four before ALCO sets deposit pricing for the plan year. Where they agree, you have a finding for the board. Where they disagree, you have your ALCO agenda item.
What to Bring to Your Next Board Meeting
This fall a director is going to ask what this bank has done to prepare for rates moving next year. The weak answer benchmarks against the industry outlook. The strong answer is a document.

Here is what a Know Your Peers report contains. Build one for your own bank and peer set at askstatum.amberoon.com/peer-group.
- Where we stand: The Statum GPA, forecast 18 months out, for us and for each of the seven
- The peer set, named: Which seven banks every number in the report is measured against
- The scorecard: Where we rank on each measure against the peer median, with the gap in basis points
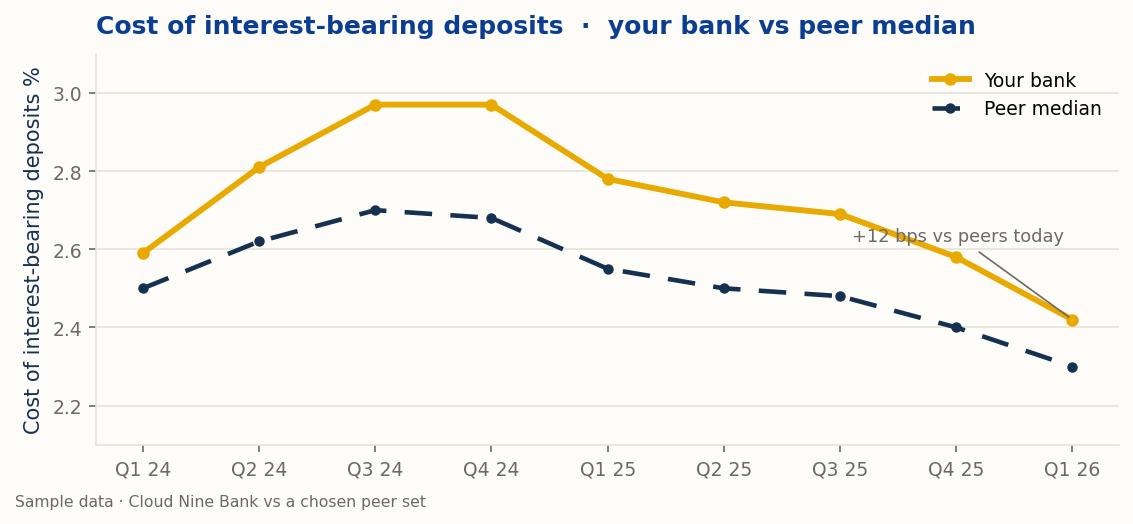
- Funding, what our money costs: Cost of interest-bearing deposits against the peer median, eight quarters
- Funding, the mix and the stickiness: Core, brokered, wholesale, uninsured, loans to deposits, all eight banks
- Funding, did the money stay: Deposit pricing and deposit balances across the full rate cycle
- Earnings and efficiency: Return on assets and equity, margin, and what they cost to produce
- Credit risk and capital: Past due, charge-offs, reserve coverage, CRE concentration, Texas ratio, TCE
- What the gaps are worth: Every gap converted to dollars of pretax income a year
- Where to focus: The two or three moves with the most room in them
The first row is the one no other benchmark carries. The Statum GPA is a single bank-health grade from 1 to 9 that forecasts where a bank will stand up to 18 months ahead, rolling earnings, margin, funding, asset quality and capital into one number. Your grade and your peers' sit on the same scale, so the gap is the finding. It is a model, not a filing, and it should be read as one. That is what the Statum Variability Index is for: it carries the confidence range around the grade, and a board should weigh a wide range differently from a tight one.
Two more rows a size bucket can never produce. The peer set can be named, so a director can ask why a particular bank is in it. And every gap is priced, because a board does not act on 15 basis points, it acts on what 15 basis points does to pretax income.
Know Your Peers builds that report from the Call Reports and carries it forward, pairing what each peer has filed with an 18-month outlook on where each one is heading. Every historical figure traces back to a filing, and every forward figure is computed from those filings rather than borrowed from someone's house view.
The Air Force Did Not Build a Better Average
Faced with a cockpit that fit nobody, the Air Force did not commission a more accurate average pilot. It threw out the requirement. It ordered cockpits that adjusted to whoever was flying, and the seat you slide back in your car is a direct descendant of that decision. Nobody has designed for the average pilot since.
A plan built on one industry forecast is a fixed seat. A plan built on what your own seven did the last three times funding costs turned adjusts as the cycle turns.
The banks that go quiet over the next two years will not go quiet for missing the industry average. They will go quiet because nobody in the building knew what the bank across the street was paying for money, and by the time it showed up in the margin it had been true for four quarters. No accident report gets filed. There is a press release about a strategic partnership.
Your seven competitors filed this month. Go pull their numbers and read them line by line: what they pay for deposits, what they earn on loans, which way their margin turned, and what it cost them to get there. Know Your Peers puts all seven beside your bank in one report, built from those same filings.
Build your own peer group at askstatum.amberoon.com/peer-group, and see why the average misleads at askstatum.amberoon.com/flaw-of-averages
Popular Posts
Last week the Federal Reserve did the one thing...

In February 2026, Anthropic ran a Claude Code...