

Last week the Federal Reserve did the one thing nobody could trade on: nothing. It left rates unchanged at 3.50 to 3.75 percent, and the hold itself was the news, even as its own projections hinted the next move could be back up. So now every bank is trying to read its own next move: how fast to keep cutting deposit costs, whether to brace for another hike, how long to sit tight. We have had a hiking cycle since 2022, a cutting cycle since late 2024, and now a nobody-knows cycle.
Here's the thing, though. The move that decides your margin isn't the one you make against the Fed. It's the one you make against the bank across the street. There's an old joke about two hikers who meet a bear in the woods. One kneels to lace up his running shoes. "You can't outrun a bear," the other says. "I don't have to outrun the bear," he answers. "I just have to outrun you." Every community bank is in that forest right now. The bear is the rate cycle, and no one outruns it. You don't have to beat the Fed. You have to beat the bank across the street.
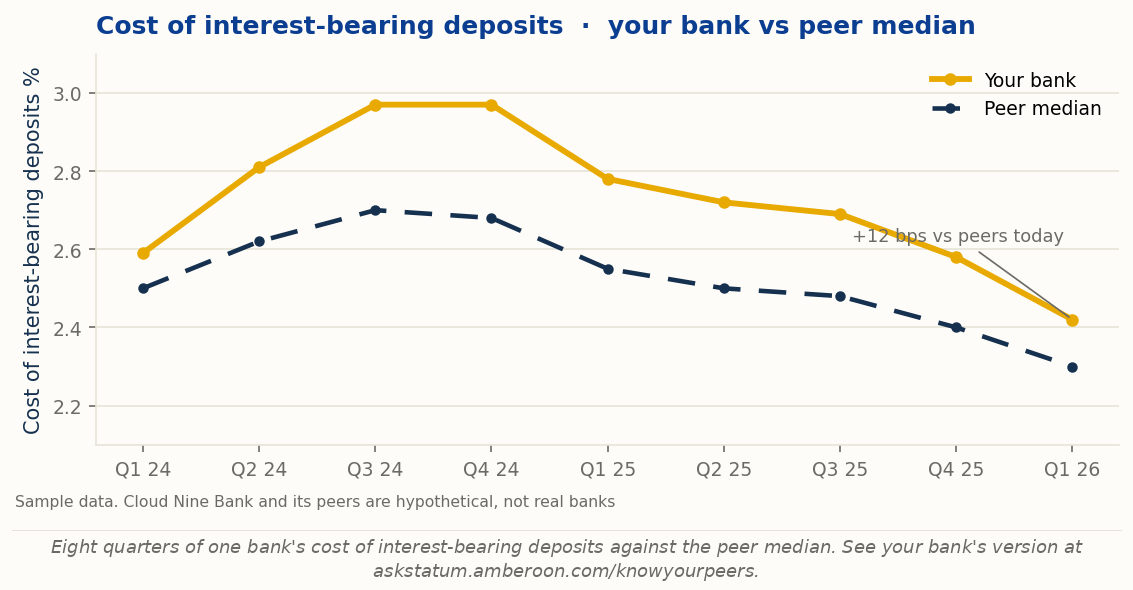
You already keep an eye on the bank across the street. Rate sheets, local specials, the weekly moves, most teams track all of that. What is harder to assemble is the longer view: how each peer actually behaved across a full rate cycle, when the Fed was hiking and again when it turned. That sits in public data, but pulling it together bank by bank is slow, manual work, so it usually goes undone. Know Your Peers (KYP), a new dashboard inside Ask Statum, takes that friction out. It pulls every bank's deposit beta and funding profile, lets you swap your peer group in or out at the flip of a switch, and shows how each one responded when rates climbed through 2022 and 2023 and how fast they cut once rates turned in late 2024, and whether their deposits stayed while they did it. You can't predict a rival, but you can read its track record, and how a bank handled the last rate moves is the best clue to how it will handle the next. The graph above is where that record starts, drawn in deposit costs.
The Number Bankers Need but Can't Easily Get
That race has a name, and it is the number bankers know cold at their own shop and have to work to see at anyone else's: deposit beta. Beta is how much, and how fast, a bank moves its own deposit rates when the market moves, with the Fed standing in for the market, and set against your peers it is what decides whether you defend net interest income or give it away. A beta of 20 percent means that when rates rose 100 basis points, the bank's deposit cost rose 20. A low beta is a durable, low-cost franchise the bank controls. A high beta is a bank renting its deposits at the going rate. Most banks already know their own beta. A peer's is the hard part. No bank reports a standardized deposit-beta figure, so getting one means subscribing to a proprietary data service or deriving it yourself from public filings, quarter by quarter, bank by bank. It can be had, but only with a budget or the time to dig it out, and that is exactly the wall smaller banks run into.
Price the Gap in Dollars, Not Basis Points
A percentile is forgettable. A dollar figure moves a board. Between early 2022 and the middle of 2023 the Federal Reserve raised rates about 525 basis points. How much of that each bank passed through to depositors varies widely. In a January 2023 outlook, S&P Global Market Intelligence projected community banks would record a deposit beta around 28 percent for 2023, with a cumulative beta near 22 percent by year-end. The inputs needed to estimate deposit beta, deposit interest expense and interest-bearing balances, sit in every bank's quarterly Call Report, but no bank reports a standardized deposit-beta figure directly, so a peer's has to be calculated rather than looked up. That spread is not an abstraction, it is net interest income: money you keep when your beta beats the field, and money that walks out the door when it does not. On a bank with 500 million dollars in interest-bearing deposits, a 50 basis point difference in deposit pricing is 2.5 million dollars of net interest income a year. Know Your Peers computes each peer's beta for you, pre-processed, with no subscription and no spreadsheet, and puts the gap in dollars against the peer set you choose, so the question stops being how does our beta look and becomes how much is last cycle's pricing still making or costing us this quarter.
Whether You Read the Rate Cycle Right, Shows Up Later
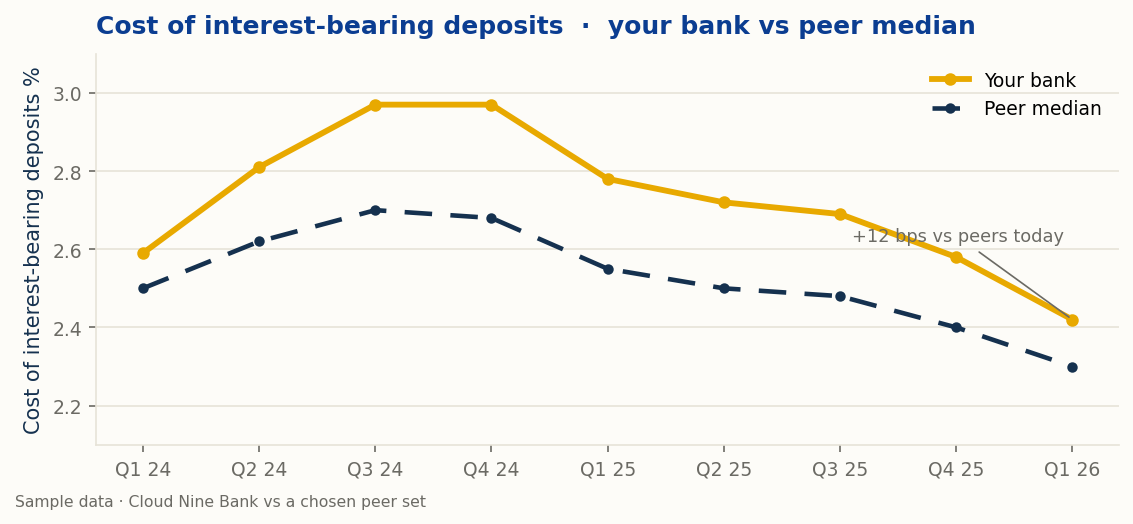
You priced the last rate cycle on a read: how hard your peers were bidding, how long rates would hold, whether the move would stick. That read went onto the rate sheet by product and by deposit tier, and you only learn whether it was right after the fact, from what your peers did and how your deposit balances performed. A bank that held its rates down while the market climbed looks sharp until the deposits run off and come back as wholesale CDs and FHLB advances. The two slopes in the cost of interest-bearing deposits trend above are that record: not whether you cut or held deposit rates, but whether you read the cycle the way the banks across the street did, and what it cost you when you did not. Over a quarter that is noise. Over eight quarters it is a pattern.
A Low Beta Only Counts If the Money Stays
There is a second number that decides whether a low beta is a win or a warning, and it is what happened to the deposit balances. Pricing beta tells you how far a bank moved its deposit rates. Balance beta tells you what those rates did to the deposits themselves. Hold your rates down while the market climbs and one of two things happens. Either the money stays, and you have squeezed more net interest income out of a depositor base that does not chase rates, or the money runs off, and that low rate was bought with runoff you will pay for later. A bank with a rate-insensitive depositor base, such as an older customer demographic, a market with only a few peers and less deposit competition, can keep rates low and keep the balances at the same time, which is the most profitable place a deposit franchise can sit. So pricing and balances have to be read together. A peer that held rates flat and kept its deposits is playing a different game from one that held rates flat and lost them, and only the two numbers side by side tell you which is which. Know Your Peers shows both for every bank on your list: how each one priced through the cycle, and how its balances responded.
Beta Is Where the Comparison Starts, Not Where It Ends
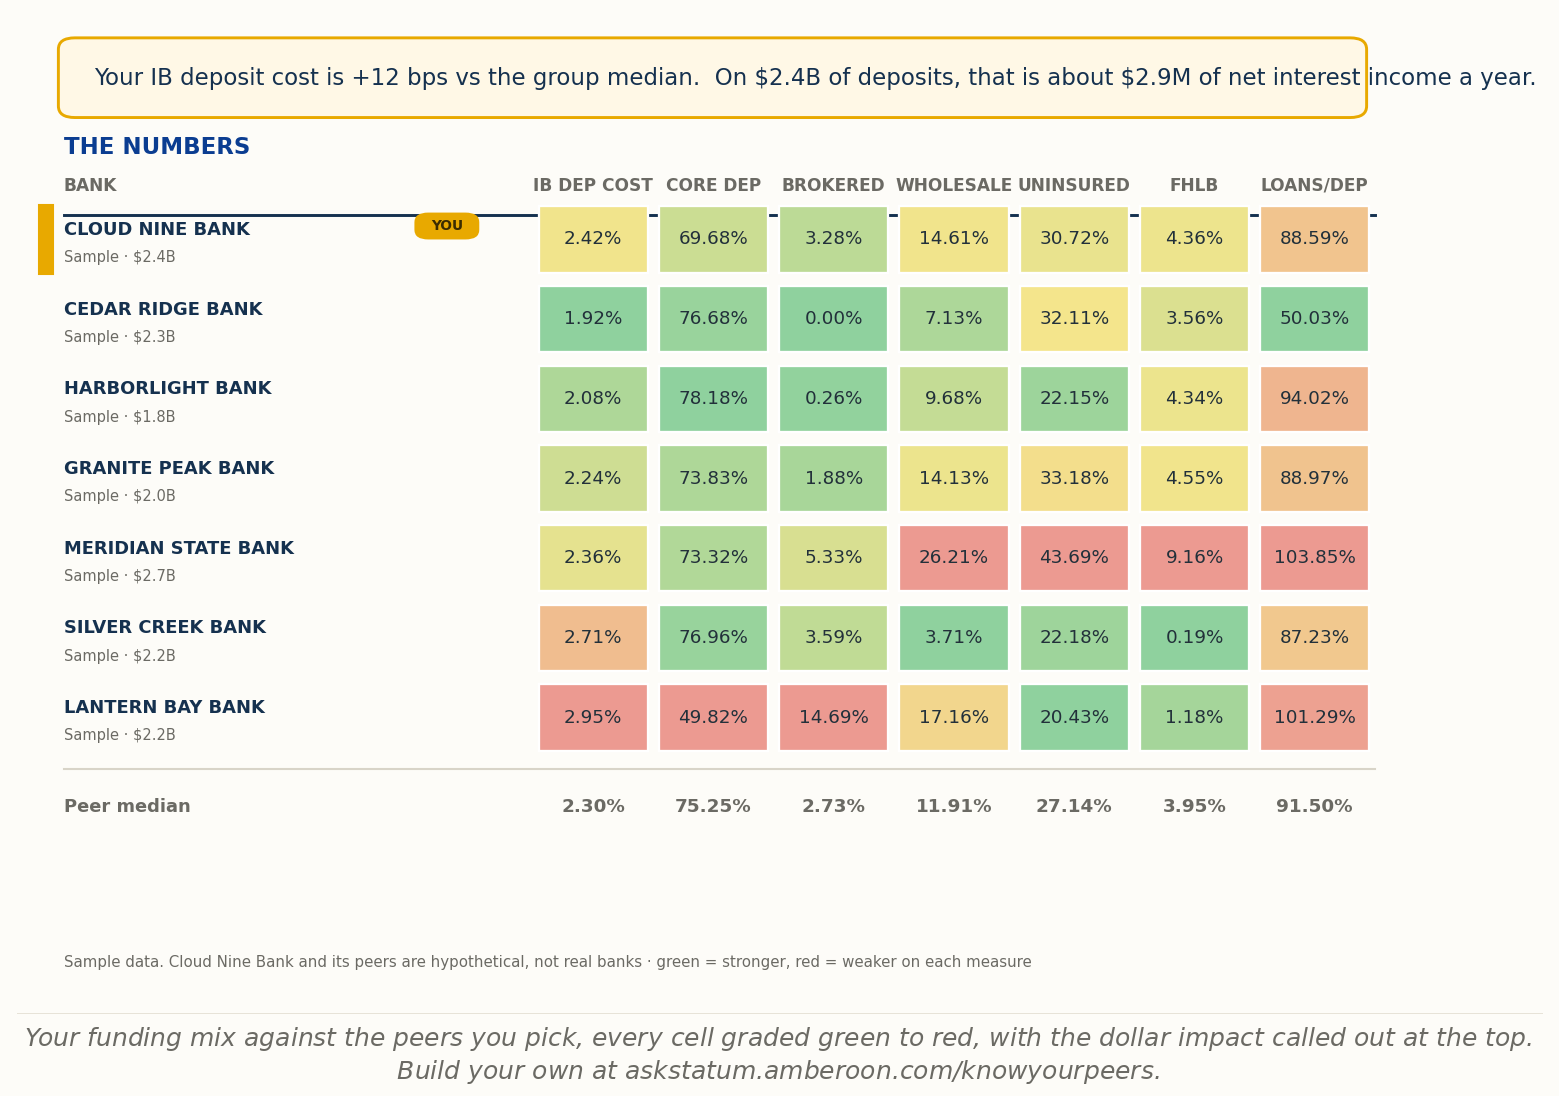
Deposit beta is where this starts, not where it ends, because the real product is competitive analysis. The same peer set you build for beta is graded across everything else that decides a bank's standing: the Statum GPA, a single forward-looking health grade, alongside earnings and margin, asset quality, and capital. The funding view is one cut, your funding profile line by line against each peer, with the dollar cost of the gap called out at the top. Behind it sits a board scorecard and a margin view that shows where your spread actually comes from. Pick the banks you genuinely compete with, by region, size, or name, and every view recomputes against them: cost of funds, deposit mix, uninsured deposits, loans to deposits, net interest margin, efficiency, and capital.
The obvious objection is that you already have a peer group. Every bank does, the one the UBPR assigns by asset size and metro status. But an assigned group is not the set you actually compete with, and it names no one. Know Your Peers lets you build the peer group yourself, bank by bank, the peers across the street and the ones taking your deposits, and pin a single named peer to track quarter over quarter. A comparison is only as good as the peers in it, and you know best who those are.
Your Board Deck, Built in One Click
Picture the week before a board meeting. Somewhere an analyst is stitching peer numbers into slides late at night, rebuilding a deck that fell out of date the moment the quarter closed. That scramble is the norm, and it is the part Know Your Peers takes off your plate. With your peer group chosen, KYP builds the package for you: a board-ready PowerPoint deck and a written report laying out your competitive standing and your deposit beta against your peers, with the tier-by-tier pricing detail left where it belongs, in front of the ALCO. The largest banks keep entire teams busy on work like this.
Frequently Asked Questions
What is deposit beta?
Deposit beta is how much, and how fast, a bank moves its deposit rates when market interest rates move, with the Fed used as a proxy for the market. A 20 percent beta means a 100 basis point interest rate move raises the bank's deposit cost by 20 basis points. A lower beta signals a cheaper, stickier deposit base.
What is the difference between pricing beta and balance beta?
Pricing beta is how much a bank moves its deposit rates when the market moves. Balance beta is how much its deposit balances move as a result. A low pricing beta only adds to net interest income if the balances hold; if the deposits run off, that low rate was paid for in runoff. Know Your Peers shows both for the peer set you choose.
Is a peer bank's deposit beta public?
A bank's deposit beta can be derived from its quarterly Call Report, which is public, but no bank reports the figure directly and there is no standard public lookup, so it has to be calculated. Know Your Peers computes it from that public data for the peer set you choose.
How do I compare my bank's deposit beta to peers?
Build a peer set on Ask Statum by region, size, or name, and Know Your Peers lays each bank's deposit beta and funding mix side by side, with the gap to the peer median translated into dollars.
What does a 50 basis point deposit pricing gap cost?
On a bank with 500 million dollars of interest-bearing deposits, a 50 basis point pricing gap is about 2.5 million dollars of net interest income a year. Know Your Peers prices that gap against your own balance sheet.
Build Your Set, Then Outrun the Field
You cannot outrun the rate cycle, and you do not need to. What you can see, in dollars and in plain grades, is how you stand against the banks in your own backyard, in a form you can hand to your Board. That is what Know Your Peers from Statum KPI puts in one place, the whole Board agenda instead of ten tools in ten lanes.
Know Your Peers is one of the dashboards inside Ask Statum, Amberoon's analytics workspace for community banks, so once you're there you can explore the rest of it too. Open it at askstatum.amberoon.com/knowyourpeers. Access is free and unrestricted through July 3rd.
Popular Posts
Last week the Federal Reserve did the one thing...

In February 2026, Anthropic ran a Claude Code...