Just like Business to Consumer (B2C) e-commerce and Business to Business (B2B) e-commerce…we are seeing a similar distinction emerge in Big Data.
While social, consumer, retail and mobile big data get a lot of PR, the big data business cases around industrial machine data analytics or “things that spin” actually make economic sense. These projects tend to show tangible Return on Investment (ROI). 
The concept of Internet-connected machines that collect telemetry data and communicate, often called the “Internet of Things or M2M” has been marketed for several years:
- I.B.M. has its “Smarter Planet” initiative
- Cisco has its “Internet of Everything” initiative
- GE has its “Industrial Internet” initiative.
To compete with GE….Hitachi, United Technologies, Siemens, Phillips and other industrial giants are all getting on the band-wagon as the vision of M2M is now viable with advances in microelectronics, wireless communications, and microfabricated (MEMS) sensing enabling platforms of rapidly diminishing size.
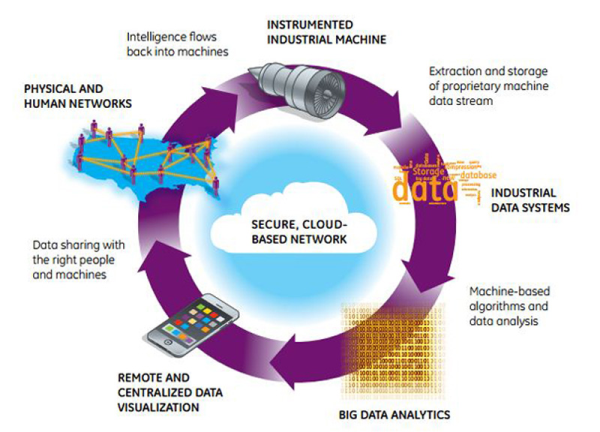
The industrial B2B value chain is shown below.The focus of industrial firms which produce  power plant turbines, rail locomotives, aircraft engines, efficient power distribution, medical imaging equipment, medical diagnosis, smart energy management, sensor rich home automation etc. is different than the Consumer Big Data.
The business case is centered on boosting efficiency gains and productivity improvements rather than a new innovation or experience. However the underlying ingredients are the same — tools from data science, machine learning, visualization and management of vast streams of new floods of data from smaller, more powerful and cheaper sensors.
Caterpillar, Komatsu and other equipment giants are also pushing the machine data use cases. Take for instance John Deere, which uses sensors + GPS to assist farmers in managing their agri fleet. The goal is to decrease downtime of their tractors, combines as well as save on fuel. The information is combined with historical and real-time data regarding weather prediction, soil conditions, crop features and many other data sets. The information is presented in the MyJohnDeere.com platform as well as on the iPad and iPhone app Mobile Farm Manager in order to helper farmers figure out which crops to plant where and when, when and where to plough, where the best return will be made with the crops and even which path to follow. The target goal – higher production and revenue for farmers.
The fundamentals behind these initiatives and projects are pretty much the same. If the analytics around machine data achieves just a 1% efficiency improvement in cost reduction or efficiency gain then the business case for Machine or Sensor Data capture, harvesting and analytics is truly impressive.
Here are a few ROI examples from a 1% improvement in productivity across different industries:
- Commercial aviation industry — a 1% improvement in fuel savings would yield a savings of $30 billion over 15 years.
- Utilities — In global gas-fired power plant fleet a 1% improvement could yield a $66 billion savings in fuel consumption.
- Global health care industry — A 1% efficiency gain from reduction of process inefficiencies globally could yield more than $63 billion in health care savings.
- Railway Networks — Freight moved across the world rail networks, if improved by 1% could yield another gain of $27 billion in fuel savings.
- Upstream Oil and Gas Exploration – a 1% improvement in capital utilization upstream oil and gas exploration and development could total $90 billion in avoided or deferred capital expenditures.
The convergence of intelligent devices, intelligent networks and intelligent decisioning (Insight vs. Hindsight analytics) is definitely paving the foundation for the next growth spurt or productivity gains. Here is a great graphic from GE that I found interesting.

1% Machine Data Analytics Use Cases
So what are some use cases that are pertinent to Machine Data Analytics that will enable the 1% improvement?
Asset management and predictive maintenance is a universal use case. Machines tend to fail eventually so optimal, low-cost, machine maintenance across fleets facilitated by intelligent systems is a standard use case. An aggregate view across machines, components and individual parts provides a line of sight on the status of these devices and enables the optimal number of parts to be delivered at the right time to the correct location. This minimizes parts inventory requirements and maintenance costs, and provides higher levels of machine reliability. Intelligent system maintenance optimization can be combined with network learning and predictive analytics to allow engineers to implement preventive maintenance programs that have the potential to lift machine reliability rates to unprecedented levels.
Supply Chain optimization. To illustrate the supply chain and logistics challenge being tackled with sensors and machine data, consider the perishables supply chain like bananas. Bananas are a popular item in any grocery store—nearly everybody buys them—and both the price and the ripeness must be just right. To ensure that no bunch is too green or too brown, bananas are picked and packed so they ripen in transit. Goal for every shipment is to arrive at the store delicious and ready to buy. But this creates a logistics nightmare—timing is everything, and being too early is as bad as being too late. When bananas arrive in bad condition the whole truckload has to be rejected and disposed safely.
So how does the instrumentation actually work? Temperature sensors could be attached or embedded inside the package. Such sensors must be small and inexpensive to the point of being disposable. The temperature can be monitored via readers or a storage capacitor (roughly the size of a pea) can be attached to the RFID sensor to log data for up to a day when out of range of a reader.
Health Care Network Optimization: The operation of interconnected machines within a system can be coordinated to achieve operational efficiencies at the network level. For example, in health care, assets can be linked to help doctors and nurses route patients to the right care stations more quickly. Information can then be seamlessly transmitted to care providers and patients resulting in shorter wait times, higher equipment utilization, and better quality care.
Transportation Optimization. Intelligent systems are also well suited for route optimization within transportation networks or delivery networks like FedEx or UPS. Interconnected vehicles will know their own location and destination, but also can be alerted to the location and destination of other vehicles in the system— allowing optimization of routing to find the most efficient system-level solution.
All these use cases – store, manage and deliver value from fast, massive data sets - tend to have a similar data collection, harvesting and analytics structure. See also complementary blog post – Big Data Use Cases
Industrial Analytics Project Phases
There are four main stages of any industrial analytics project – Educate, Explore, Engage and Execute.
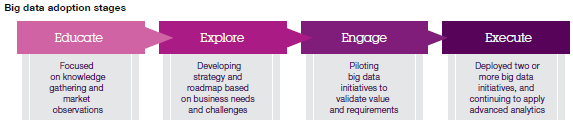
- In the Educate stage, the primary focus is on awareness and knowledge development.
- In Explore stage the focus is on developing an organization’s roadmap for big data development.
- In the Engage stage, organizations begin to prove the business value of big data, as well as perform an assessment of their
- technologies and skills.
- In the Execute stage, big data and analytics capabilities are more widely operationalized and implemented within the organization.
However, getting the solution architecture via throw-away pilots is a major first step.
Basic Architecture of What GE Industrial Internet is building off
Classic data warehouses and batch analytics is not viable for the high frequency and high velocity industrial internet.
An infrastructure that scales between always-on, real-time and near real-time, in-memory analysis and machine-learning, batch analytics at different locations from machine to cloud – private, public, or hybrid – is a necessary foundation.
Innovative strategies require regular collection and aggregation of high-quality data.
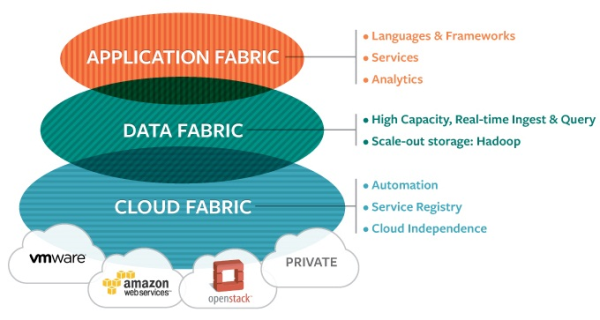
GE has recently invested$105 M in new spinout from VMware and EMC named Pivotal. Pivotal One is a Enterprise Platform-as-a-Service (PaaS) that makes it possible to create consumer-grade big data or analytics applications.
Pivotal PaaS is attempting to provide a data fabric that is a convergence of vFabric, Channel Partnerships, Hybrid Storage Strategies, and Appliance Manufacturing and Distribution, and vSphere/vCloud Optimization.
Summary
Big data in industrial setting is going to be where some big action is taking place. The full power of the Industrial Internet or “internet of things” is clearly being realized with a third element—data and analytics. Intelligent decisions occur when data from devices and systems is analyzed to facilitate data-driven learning, which in turn enables machine and network-level operational functions to be automated. Intelligent feedback control systems.
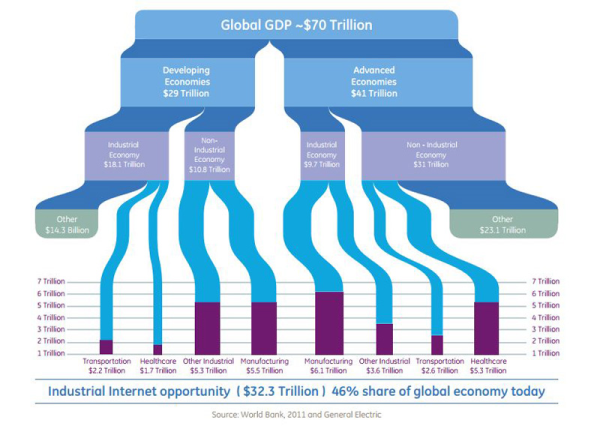
According to GE research below…the economic impact of this is pretty significant and sizable.
Notes and References
- Checkout MIT’s Institute for Soldier Nanotechnologies, for some amazing trends in the fusion of RFID and sensors. Also checkout http://www2.seattle.intel-research.net/~jrsmith/2008-hotnets-wisp.pdf for more use cases.
- GE seems to be ahead of everyone else in executing the vision. GE is making a push around the “Industrial Internet” — bringing digital intelligence to the physical world. It created a new software and analytics division staffed with a 1000+ work force of computer scientists and software developers, investment of $2 billion by 2015.
- John Deere uses the open source programming language R for data analysis. R helps John Deere to forecast demand correctly, to forecast crop yielding, to determine land area and usage as well as help John Deere forecast the demand for (spare) parts of the combines. They use Open Database Connectivity to port the multiple data sources and data types. R is then used to export this data into different channels.
- GE estimates that technical innovations of the Industrial Internet could find direct application in sectors accounting for more than $32.3 trillion in economic activity. As the global economy grows, the potential application of the Industrial Internet will expand as well. By 2025 it could be applicable to $82 trillion of output or approximately one half of the global economy.
- Also check out a complementary blog post… Splunk and Machine Data Analytics
- GE is taking a 10 percent stake and investing $105 million in Pivotal, the spin-out from EMC and VMware. GE has also partnered with Accenture to create Taleris – a joint venture to provide airlines and cargo carriers around the world with intelligent operations services, focused on improving efficiency by leveraging aircraft performance data, prognostics, recovery and planning optimization solutions.
- http://www.gesoftware.com/Industrial_Big_Data_Platform.pdf
Related articles
- GE Launches Cloud Platform for the Industrial Internet (datacenterknowledge.com)
- Ready for the Industrial Internet? GE Announces “Predictivity” Platform, New Partnership With Amazon Web Services (allthingsd.com)
- General Electric joins the ‘big data’ party (venturebeat.com)
- http://www.zdnet.com/ge-intros-cloud-agnostic-data-platform-with-pivotal-amazon-web-services-7000016962/ -
- GE is taking a 10 percent stake and investing $105 million in Pivotal, the spin-out from EMC and VMware
Popular Posts
Last week the Federal Reserve did the one thing...

In February 2026, Anthropic ran a Claude Code...