 Today there is a strong move towards “Consumerization of BI” as business users are demand the same speed, dashboards and ease of use from their workplace applications as their at-home software.
This is a major catalyst for change. In every major corporation there is a renewed push to industrialize and improve data visualization.
The challenge is not in procuring the next greatest tool or platform but how to organize the people, process and assets effectively to create value, reduce training and support costs.
In other words, how to facilitate and create a flexible operating model for data mining and visualization delivery that provides discipline at the core while giving the business the agility that they need to make decisions or meet client needs?
Decision making is a core business activity that requires facts and insights. Slow, rigid systems are no longer useful enough for sales, marketing and other business users or even IT teams that support them. Competitive pressures and new sources of data are creating new requirements. Users are demanding the ability to answer their questions quickly and easily.
So the new target state is to empower business users along the Discover, Decide and Do lifecycle:
- Discover new insights by rapidly accessing and interrogating data in ways that fit how people naturally think and ask questions.
- Decide on best actions by publishing dashboards, collaborating with others, discussing insights and persuading others through data presented in an interactive application (“app”) rather than in a static view.
- Do what is best at each decision point with confidence, based on the consensus that develops when new data is aggregated and explored with multiple associations and different points of view. Teams can take action more rapidly and move projects forward more effectively when everyone understands the data underlying decisions.
The challenge for business users is data discovery and ease-of-use. They want to focus on aggregating and visualization. They want the interactive ability to quickly change filters and query conditions.
The challenge for infrastructure and application teams in every corporation is to deliver new easy-to-use platforms to their business partners quickly and consistently while maintaining governance and control.
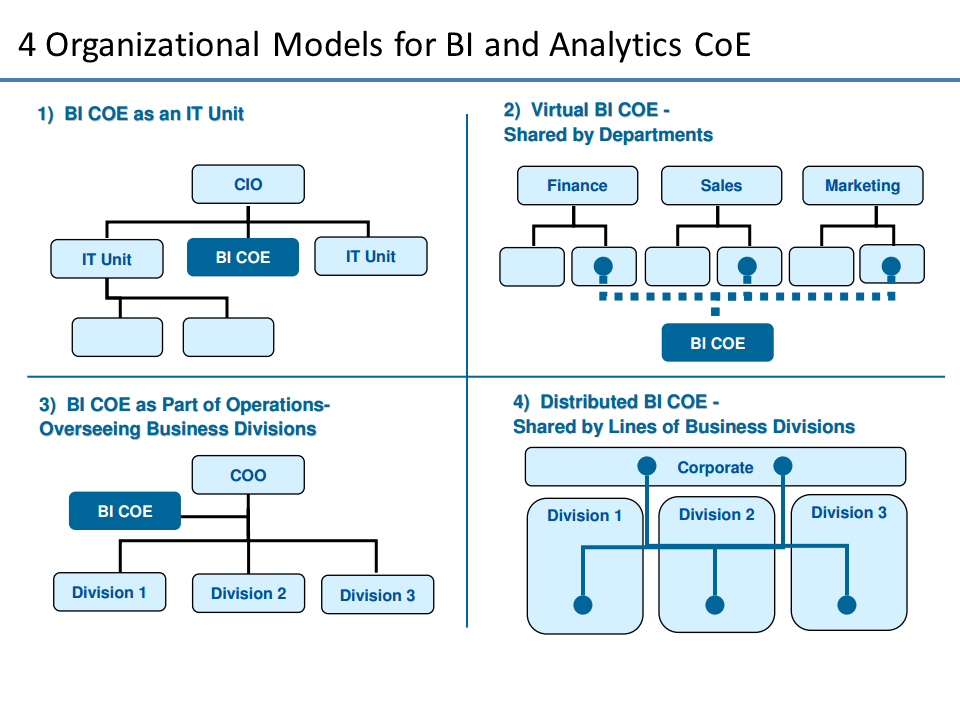
To meet both sets of requirements, best practice firms are creating Data Mining and Visualization Competency Center or Centers of Excellence (DV-CoE) to ensure that the people, process and technology investments are not duplicated and addressed in a way that maximizes ROI and enhances IT-Business partnership. I have seen many cases where not having a proper structure leads to sub-optimal results.
Business imperatives supported by DV-CoE
|
|
|
|
Reporting |
||
| * | Departmental Reporting | Static and/or parameterized reports built for internal user audiences – less need for pixel-perfect rendering and complex presentation |
| * | Corporate Reporting | Static and/or parameterized reports built for external and executive audiences (including regulatory reports) – pixel perfect and/or complex presentation |
| * | Ad-Hoc Reporting | Query or batch-based data delivery from one-off or custom requests – delivery in data set, spreadsheet or custom report form |
Discovery, Analysis, and Visualization |
||
| * | Business Discovery | Visual exploration of disparate data by business users for the purposes of discovery, what-ifs, scenarios, trending and correlations that are not yet known |
| * | Visualization | Interactive exploration of data by data practitioners, for the purposes of Pre-ETL, Correlation Analysis, Data Profiling, Data Quality, etc… |
| * | Prototyping | Rapid models and interface prototypes to prove out business value and technological fit |
Analytics |
||
| * | Statistical Analytics | Statistical analysis, trending and reporting – beyond basic statistical analysis. These are statistical/scientific analysis based on advanced modeling. |
| * | Predictive Analytics | Predictive analysis, projections, scenarios and models for future events based on historical data and controllable variables – beyond projections, what-ifs. |
Setting up a DVCoE — Fundamentals
How can we create a structure that will help business see thru the non-stop data noise.

While every organization will vary in terms of what business needs they need supported…the basics of any DVCoE are the same. They include Charter, People, Technology Process and Service Management.
-
Charter and Setup
- Vision -> Establish a guide post
- Executive Sponsorship -> Eliminate roadblocks to change
- Delivery Patterns -> Determine what will be delivered
- Project Intake -> Outline how new work will be accepted
-
People
- Roles -> Determine what resources are needed
- Team Structure -> Determine who will reside in IT or the business
- Collaboration Process -> Establish guidelines on how work is done and decisions made
- Onboarding Process -> Establish methods for on-boarding new people
-
Technology Process
- Best Practices -> Document development and UI guidelines
- Delivery Process -> Develop process for application implementation
- Governance Model -> Ensure ongoing environment stability and consistency
-
Service Management
- Metrics & KPIs -> Quantitatively define success
- Support Model -> Determine who is responsible when help is needed
- Service Level Agreements -> Establish committed SLAs
- Chargeback Model -> Establish mechanism for cost recovery
See my previous post on BI CoE or Competency Centers for a more in-depth discussion.
Next State…Mining Data
More effective consumption of data is the target for almost every organization. The focus is on allowing users to see and understand data.
Also as we move from “routine reports” to “interactive discovery”, five capabilities are needed to enable easier consumption of data include:
- Self-Service — The simplicity and ease of use of next gen visualization vendors like Qliktech, Tableau Software or Spotfire gives people the power to access, analyze and share data without the assistance of technical specialists. This self-service capability enabled by visual query languages expands the potential user population within organizations.
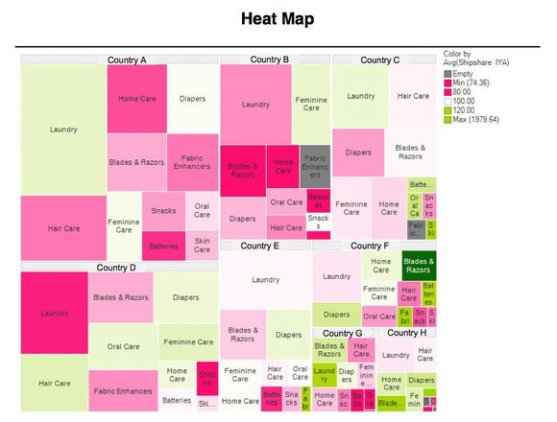
- Discovery — The human mind is better able to process information, discern trends and identify patterns when presented with information in a visual format. By integrating analysis, queries and graphics, software allows people to create powerful visualizations and dashboards that can lead to new discoveries. New capabilities from vendors is designed to seamlessly blend, filter and drill down on information, without the distraction of dialogue boxes, wizards and scripts, allowing users to rapidly and iteratively develop greater insight from their data.
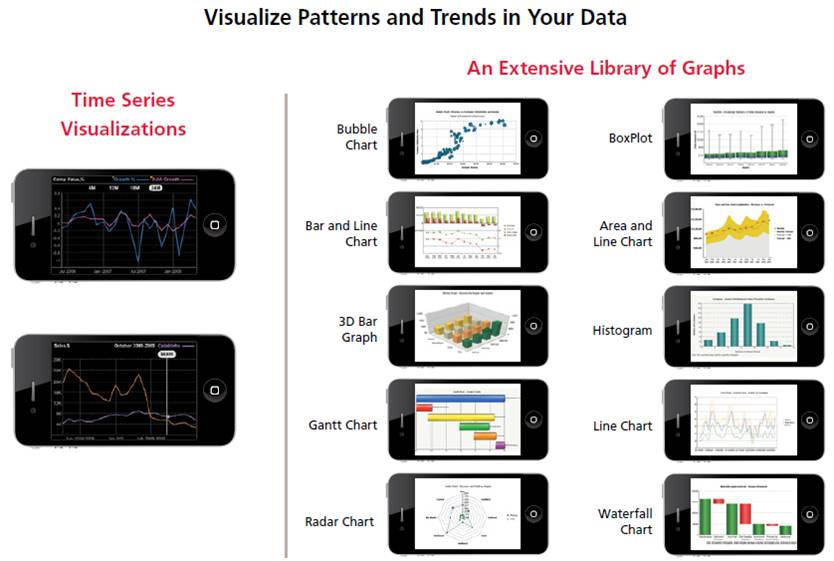
- Mobility. Decision makers at all levels in an organization need readily available data. Tablets, phones and other mobile devices help to make business data ubiquitous. Unlike traditional BI solutions, which address the need for mobile solutions by delivering static reports and dashboards to mobile devices, mobile platforms provides an intuitive interface and an application infrastructure that is designed to enable users to explore data and draw associations and insights wherever they happen to be working.
- Speed — Enable people to derive value from their data at an accelerated pace. Due to a growing focus on ease of use and ease of deployment, enterprise users can quickly gain proficiency and generate results rapidly, without the complication, time investment and frustration often associated with traditional BI products.
- Linkage — New software is able to connect directly to a broad range of data sources, enterprise users can perform work without having to undertake complex and time-consuming data movement and transformation.

Users of Visualization
|
IT Report Authors | Statisticians | Analysts and Consumers |
See and Understand Data – Visualization Vendors
|
|
|
|
- See this Blog Post for more on visualization vendors
- See this Blog Post on NoSQL and Spark Ecosystems
Traditional Enterprise BI Platforms are quickly becoming Legacy Platforms
 It is my opinion that most of the dominant BI platforms from the last decade (IBM Cognos, SAP Business Objects) are rapidly becoming legacy platforms. Value migration is taking place from old to new.
Traditional BI solutions have become complex product “stacks” that combine multiple disparate products into a single “solution.” Due to the complexities and overhead of these large stacks, we believe that a typical BI implementation takes twelve to eighteen months, or more. By that time the business, and the business user requirements, may have significantly evolved or changed, resulting in an extensive queue of user requests to update and revise reports or dashboards. Even simple changes can take weeks or months to implement resulting in a solution that we believe is always a few steps behind the business user’s requirements.
As a result, most BI products can only help people answer questions that are understood in advance (“routine decisions”). In contrast, next generation data discovery platforms are designed to be iterative in nature by enable users to interrogate live data, and uncover insights they can use to see hidden trends, make discoveries and solve problems in new ways.
The newer breed of iterative data visualization tools, for instance, Qlikview Business Discovery platform empowers non-technical users to explore data freely, with just clicks, learning at each step along the way and coming up with next steps based on those findings naturally. Qlik calls this Natural Analytics™ — an approach that utilizes people’s innate ability to detect patterns, compare, sort and categorize information, anticipate outcomes and collaborate on decisions.
The objective is to:
- Enable users to explore complex data, making and sharing discoveries using natural human abilities rather than being taught advanced techniques;
- optimize data structures, the analytical query engine, the interactive user experience, visualizations and collaboration;
- encourage browsing and exploration, categorization and other decision making processes, tapping into our natural human ability to process complex information; and
- replicate the way the human brain searches for information, makes connections between various findings and uncovers insights through association, comparison and anticipation.
Summary – Why Change?
While most firms have implemented traditional BI platforms like SAP BusinessObjects or IBM Cognos, they are realizing that these platforms fail to provide timely and innovative insights to business users due to inflexible data architecture, poor usability and substantial upgrade time and costs. As a result of these limitations, many business users have turned to alternative tools to help them perform data analysis and visualization.
New platforms are emerging to mitigate the gaps in existing enterprise BI platforms.
- Traditional BI solutions require the development of a pre-defined summarization of the data, or data warehouse to support static query and reporting tools.
- Traditional BI solutions can be difficult to update and require substantial investments to refresh the underlying data.
- Even simple queries can be time-consuming and complex and often require significant professional services support to complete.
Also, the user of these platforms is shifting from a power user to a everyday user. The traditional BI tools were developed for data analysts and other quantitative professionals, like statisticians, and are driven and deployed by IT departments in a top-down approach. These systems require programming skills to construct or modify predefined, inflexible data sets, known as “data cubes.” These tools are used by data analysts or IT professionals to produce static reports or pre-configured dashboards which the business user cannot easily modify or explore in an interactive manner.
A typical business user wants easy to use data mining and visualization software. They does not possess the skills or authority needed to modify the underlying data cube and therefore must engage their IT departments to reconfigure the analysis to produce the requested information between each decision cycle. The decision cycle may be as short as a follow-on question occurring to a business user as they begin to explore a data set. As a result, business users often do not have access to critical data in a timely manner and may miss important insights and opportunities.
Enterprises are rapidly adopting a breed of “instant analytics” tools like Tableau Software to fix these gaps. With in-memory queries and data appliances, a variety of new capabilities are possible. However, technology is only part of the solution. You still need the structure, people and mindset to drive value.
References
How does it all come together?

Popular Posts


Community banks, typically those with less than...

In our recent, irreverent piece, Banking AI in...