 Insight, not hindsight is the essence of predictive analytics. How organizations instrument, capture, create and use data is fundamentally changing the dynamics of work, life and leisure.
Analytics is changing expectations and business strategies. A decade ago, GE was in the mode of “the product breaks, we fix it,” Today, GE has more than $100 billion in revenue tied to SLA contracts, whereby it gets paid based on a product — a power plant turbine, a jet engine, a locomotive — being in service. It needs predictive analytics software to help customers avoid downtime and thus make those contracts profitable. (source: Informationweek)
It’s a new world with new rules especially around consumer facing interactions. How companies find customers to how customers find companies today. How coverage with few/isolated channels were enough to now scrambling to handle exploding/integrated channels. How demographic segmentation was enough to complex behavior segmentation to drive 1:1 relationships.
I strongly believe that we are on the cusp of a multi-year analytics revolution that will transform everything. Analytics and Big Data will be highly disruptive to some industries, affecting not only revenue and cost structures but also shaking up the core business and operating models.
Using analytics to compete and innovate is a multi-dimensional issue. It ranges from simple (reporting) to complex (prediction).
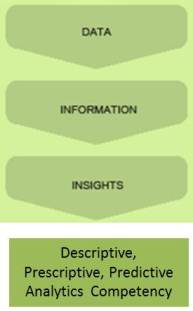
Reporting on what is happening in your business right now is the first step to making smart business decisions. This is the core of KPI scorecards or business intelligence (BI). The next level of analytics maturity takes this a step further. Can you understand what is taking place (BI) and also anticipate what is about to take place (predictive analytics).
By automatically delivering relevant insights to end-users, managers and even applications, predictive decision solutions aims to reduces the need of business users to understand the ‘how’ and focus on the ‘why.’ The end goal of predictive analytics = [Better outcomes, smarter decisions, actionable insights, relevant information].
How you execute this varies by industry and information supply chain (Raw Data -> Aggregated Data -> Contextual Intelligence -> Analytical Insights (reporting vs. prediction) -> Decisions (Human or Automated Downstream Actions)).
 There are four types of data analysis:
- Simple summation and statistics
- Predictive (forecasting),
- Descriptive (business intelligence and data mining) and
- Prescriptive (optimization and simulation)
Predictive analytics leverages four core techniques to turn data into valuable, actionable information:
- Predictive modeling
- Decision Analysis and Optimization
- Transaction Profiling
- Predictive Search (supervised learning)
Predictive Modeling
Predictive modeling identifies and mathematically represents underlying relationships in historical data in order to explain the data and make predictions, forecasts or classifications about future events.
Predictive models typically analyze current and historical data on individuals to produce easily understood metrics such as scores. These scores rank-order individuals by likely future performance, e.g., their likelihood of making credit payments on time, or of responding to a particular offer for services. Predictive models can also detect the likelihood of a transaction being fraudulent (Risk Detection).
Predictive models are frequently operationalized in mission-critical transactional systems and drive decisions and actions in near real time. A number of analytic methodologies underlie solutions in this area including:
- Applications of both linear and nonlinear mathematical programming algorithms, in which one objective is optimized within a set of constraints,
- Advanced “neural” systems, which learn complex patterns from large data sets to predict the probability that a new individual will exhibit certain behaviors of business interest. Neural Networks (also known as Deep Learning) are biologically inspired machine learning models that are being used to achieve the recent record-breaking performance on speech recognition and visual object recognition.
- Statistical techniques for analysis and pattern detection within large datasets.
Predictive models summarize large quantities of data to amplify its value. The value chain for predictive modeling in a M2M scenario is shown below (source: Greenplum Blog). It’s all about having the right people and right models.

Decision Analysis and Optimization
Decision analysis refers to the broad quantitative field that deals with modeling, analyzing and optimizing decisions made by individuals, groups and organizations. Some applications include optimizing supply chain management, tracking key performance indicators, uncovering hidden sales opportunities and determining runaway operating costs. Whereas predictive models analyze multiple aspects of individual behavior to forecast future behavior, decision analysis analyzes multiple aspects of a given decision to identify the most effective action to take to reach a desired result.
Most consulting firms leverage decision analysis to provide custom-made data-driven solutions to a variety of business applications. Apart from statistical modeling and data analysis, the focus is also on understanding business challenges and delivering action oriented solutions.
Integrated approaches to decision analysis incorporate the development of a decision model that mathematically maps the entire decision structure; proprietary optimization technology that identifies the most effective strategies, given both the performance objective and constraints; the development of designed testing required for active, continuous learning; and the robust extrapolation of an optimized strategy to a wider set of scenarios than historically encountered.
Optimization capabilities also include a proprietary mathematical modeling and programming language, an easy-to-use development and visualization environment, and a state-of-the-art set of optimization algorithms.
Transaction Profiling
Transaction profiling is a technique used to extract meaningful information and reduce the complexity of transaction data used in modeling.
Many solutions operate using transactional data, such as credit card purchase transactions, or other types of data that change over time. In its raw form, this data is very difficult to use in predictive models for several reasons. First, an isolated transaction contains very little information about the behavior of the individual who generated the transaction. In addition, transaction patterns change rapidly over time. Finally, this type of data can often be highly complex.
To overcome these issues, a set of proprietary techniques are used to transform raw transactional data into a mathematical representation that reveals latent information, and which make the data more usable by predictive models. This profiling technology accumulates data across multiple transactions of many types to create and update profiles of transaction patterns. These profiles enable the neural network models to efficiently and effectively make accurate assessments of, for example, fraud risk and credit risk within real-time transaction streams.
Increasingly, teams are pushing the envelope of how to use information retrieval, machine learning, computational linguistics, matrix and graph algorithms, unsupervised clustering & data mining to solve predictive problems.
Predictive Search (supervised learning)
Supervised learning…. Devise an Algorithm A that: Given training set S…Finds a function F that given an input… Returns an output.
The type of target scenarios include:
- Personalization based on customer behaviors or the absence of them (“We are sorry we missed you this week at Starbucks after twelve straight weeks of enjoying your company! Here is a free “Venti Blonde” for you”);
- Personalization based on social media relationships (“Several of your Facebook friends have recently enjoyed visits to our Spa, so we’re offering you 20% off to try it yourself”);
- Personalization with regard to cross-sell sales (“We know you’ve enjoyed our sister restaurant in the past, so if you or your family visit any of our other restaurants next week, here’s a coupon for a free appetizer”);
- Personalization based on location: (“We see you have just landed in New York JFK, and your
final destination is Marriott in Times Square. Here is a $10 UBER taxi coupon to get you there in 45
minutes?”)
A range of start-ups - Cue, reQall, Donna, Tempo AI, MindMeld and Evernote - and big companies like Apple, Google, Facebook, Microsoft, GE are working on various forms of supervised learning also known as predictive search — new tools that act as personal valets, anticipating what you need before you ask for it.
Google, for instance, is continuously changing the landscape of search with predictive analytics. Larry Page, Google CEO, described the “perfect search engine” as something that “understands exactly what you mean and gives you back exactly what you want.” The shift toward contextual or predictive search is driven by data — big data.
- Google launched the practice of predictive search back in 2004 with Google Suggest, which was then renamed to Google AutoComplete in 2010.
- In 2010, Google Instant came on the scene, generating search results instantly as users type.
- Google’s Knowledge Graph in 2013 further enhances predictive search by predicting what type of information a user is searching for when they search a celebrity name “Brad Pitt” and generates specific related content right alongside normal search results.
- Google Now is the next generation of predictive search, serving as a valet or personalized assistant that can predict your needs, wants, and deep desires. This is basically taking multiple buckets of data and intelligently connecting them to facilitate decisions….everyday data supported decision making. For some, Google Now delivers important information about the traffic on your morning commute, your updated flight itinerary, and the results of last night’s hockey game on your phone, without you even asking.
- Google has bought 15 Robotics and AI companies like Deep Mind and hiring talent like Ray Kurzweil, to focus heavily on machine learning and language processing.
How does Google Now work….In order to provide relevant contextual info that relates to you and only you, Google uses your private data — people you know, documents, images, hangouts, accessing your location, e-mail, daily calendar, and other info — in order to keep tabs on things like search preferences, appointments, flight reservations, payments and hotel bookings. Or auto-suggesting restaurants from the Zagat’s guide to have dinner at.
Google Now is evolving and forms a key foundational element for Google Glass. For instance, you are running thru the airport wearing Google Glass, which uses its predictive powers to send a gate change or flight delay alert as a Glasshole arrives through the airport. Having Android on every smartphone allows Google to do extremely creative things enabling more and more of the augmented reality revolution going forward.
Google is also in a unique position to know what information people are most interested in seeing and when they want it based on the giant volume of Web searches processed by the search engine daily. The different cloud services that it enables creates a web of rich data that is unsurpassed by few other firms.
Facebook and Apple might be the closest in terms of knowledge about everyday you. Embedded in IOS 7 is a new technology called iBeacon that can pinpoint your location to within a few feet. IBeacon is software that enhances the location-tracking services in an iPhone, an iPad Mini, or any device running iOS 7. For retailers desperate to turn smartphones into a sales portal, it provides a quick way to target ads and other messages to engage consumers as they walk outside or through a store. For Apple, it’s a chance to collect valuable behavior data and create momentum for mobile wallets.
IBM is transforming itself for new era of “cognitive computing” which IBM aims to drive by offering Watson supercomputing capabilities to businesses and developers via the cloud. Watson learns from user interactions and can answer complex questions.
It’s amazing how Microsoft dropped the ball on Predictive Search enabled innovation (a textbook case of Innovator’s Dilemma).
Decision Analytics: Automated Insights is the Objective
Just because firms have a lot of data doesn’t mean they’re doing a good job of acting on it.
The core challenge is putting it all together – Science + Art + Scale. A core question that i try to evaluate firms on: Do they have the right toolset, dataset, skillset and mindset for decision analytics? What is their maturity on each of these dimensions?
 But even more fundamental is the question: Do you have the right foundation to handle the growing volume of data?
Informatica presented a great layered figure that illustrates the evolving challenge facing us as we migrate towards the Internet of Things. Asking questions of your data is only effective if you know the right questions to ask. If you don’t know where you are going…any path will get you there.
Exploratory Analytics and data discovery are new techniques aimed at helping unravel that locked information and use it to the advantage of the company. The key is a powerful merger of statistical data mining and a consultative approach which enables companies to make more effective decisions while addressing their business challenges.
However, delivering real-time actionable intelligence is not easy. Closed-loop performance systems that deliver continuous innovation and insight is the end-goal. Applications include marketing campaigns, customer behaviors, risk management, operations, financial and investment management.
Below is a figure from HP that illustrates this central tenet of predictive analytics. You are free to replace the HP products with your own vendors ![]() Enterprise data virtualization or aggregation is not trivial. The modern business analyst needs data from all over the place: the data warehouse, but also the Web, big data, production systems, as well as via partners and vendors. In fact, the typical analyst spends more than 50% of the time chasing data, which slows delivery of analytic insights and limits the time available for thorough analysis. Some refer to this conundrum as “the data problem.”
Enterprise data virtualization or aggregation is not trivial. The modern business analyst needs data from all over the place: the data warehouse, but also the Web, big data, production systems, as well as via partners and vendors. In fact, the typical analyst spends more than 50% of the time chasing data, which slows delivery of analytic insights and limits the time available for thorough analysis. Some refer to this conundrum as “the data problem.”

Who are some Predictive Analytics Providers
Predictive Analytics as a core strategy enabled by big data is happening in regulated (health, wealth) and unregulated markets (retail, media, publishing).
Full Range of Analytics include: Reporting, Relational & Multi-Dimensional OLAP, Discovery, Decisioning, Scorecards and Dashboards Vendors who provide this capability include:
- Marketing services market — Fair Issac, Acxiom, Epsilon, Equifax, Experian, Harte-Hanks, InfoUSA, KnowledgeBase, Merkle and TargetBase, among others. These vendors compete with traditional advertising agencies and companies’ own internal information technology and analytics departments.
- Origination market — Fair Issac, Experian, Equifax, and CGI, among others.

- Customer management market — Fair Issac, Experian, among others.
- Fraud solutions market — Fair Issac, Actimize, a division of NICE Systems, ID Analytics, Experian, Detica, a division of BAE, SAS and ACI Worldwide, a division of Transaction Systems Architects, in the banking market; IBM and ViPS in the healthcare segment; and SAS, Infoglide Software Corporation, NetMap Analytics and Magnify in the property and casualty and workers’ compensation insurance market.
- Collections and recovery solutions market — Fair Issac, CGI, Experian, and various boutique firms for software and ASP servicing and in-house scoring and computer science departments, along with the three major U.S. credit reporting agencies and Experian-Scorex for scoring and optimization projects.
- Insurance and healthcare solutions market — Fair Issac, Emdeon, Ingenix, ViPS, MedStat, Detica, a division of BAE, SAS, Verisk Analytics and IBM.

- scoring model builders;
- enterprise resource planning (“ERP”) and customer relationship management (“CRM”) packaged solutions providers;
- business intelligence solutions providers;
- business process management and business rules management providers;
- providers of credit reports and credit scores;
- providers of automated application processing services;
- data vendors;
- neural network developers and artificial intelligence system builders;
- third-party professional services and consulting organizations;
- providers of account/workflow management software; and
- software companies supplying modeling, rules, or analytic development tools.
Behind the Covers: Analytics Techniques in Play
|
|
|
No longer SAS or SPSS: NEW Analytics Infrastructure Techniques in Play
|
|
|
No longer 1-2-3-4: Analytics on Everything
|
|
|
Predictive Analytics Project Phases
 There are two distinct patterns in predictive analytics innovation:
- Disruptive innovation like predictive search which brings a very different value proposition and/or creates new markets!!
- Sustaining innovation like dashboards or visualization which improves performance of existing products and services.
In executing either pattern, you tend to go thru the same project steps. There are four main stages of any analytics project – Educate, Explore, Engage and Execute.
- In the Educate stage, the primary focus is on awareness and knowledge development.
- In Explore stage the focus is on developing an organization’s roadmap for big data development.
- In the Engage stage, organizations begin to prove the business value of big data, as well as perform an assessment of their technologies and skills.
- In the Execute stage, big data and analytics capabilities are more widely operationalized and implemented within the organization.
Depending on the use case engineering the Analytics solution (Raw Data -> Aggregated Data -> Contextual Intelligence -> Analytical Insights (reporting vs. prediction) -> Decisions (Human or Automated Downstream Actions)) will require choices and decisions along various dimensions.

Analytics Use Cases
“By 2014, 30% of analytic applications will use proactive, predictive and forecasting capabilities” Gartner Forecast While it is true that big data and predictive analytics is in its infancy, it is growing at a maddening pace. Projects vary from the expected to the unexpected, and even to the esoteric, whimsical and paranoid.
For a detailed posting on Analytics Use Cases see… Big Data Analytics Use Cases; for uses cases on Industrial Big Data see The Power of 1% Improvement. Some interesting use cases are illustrated below.
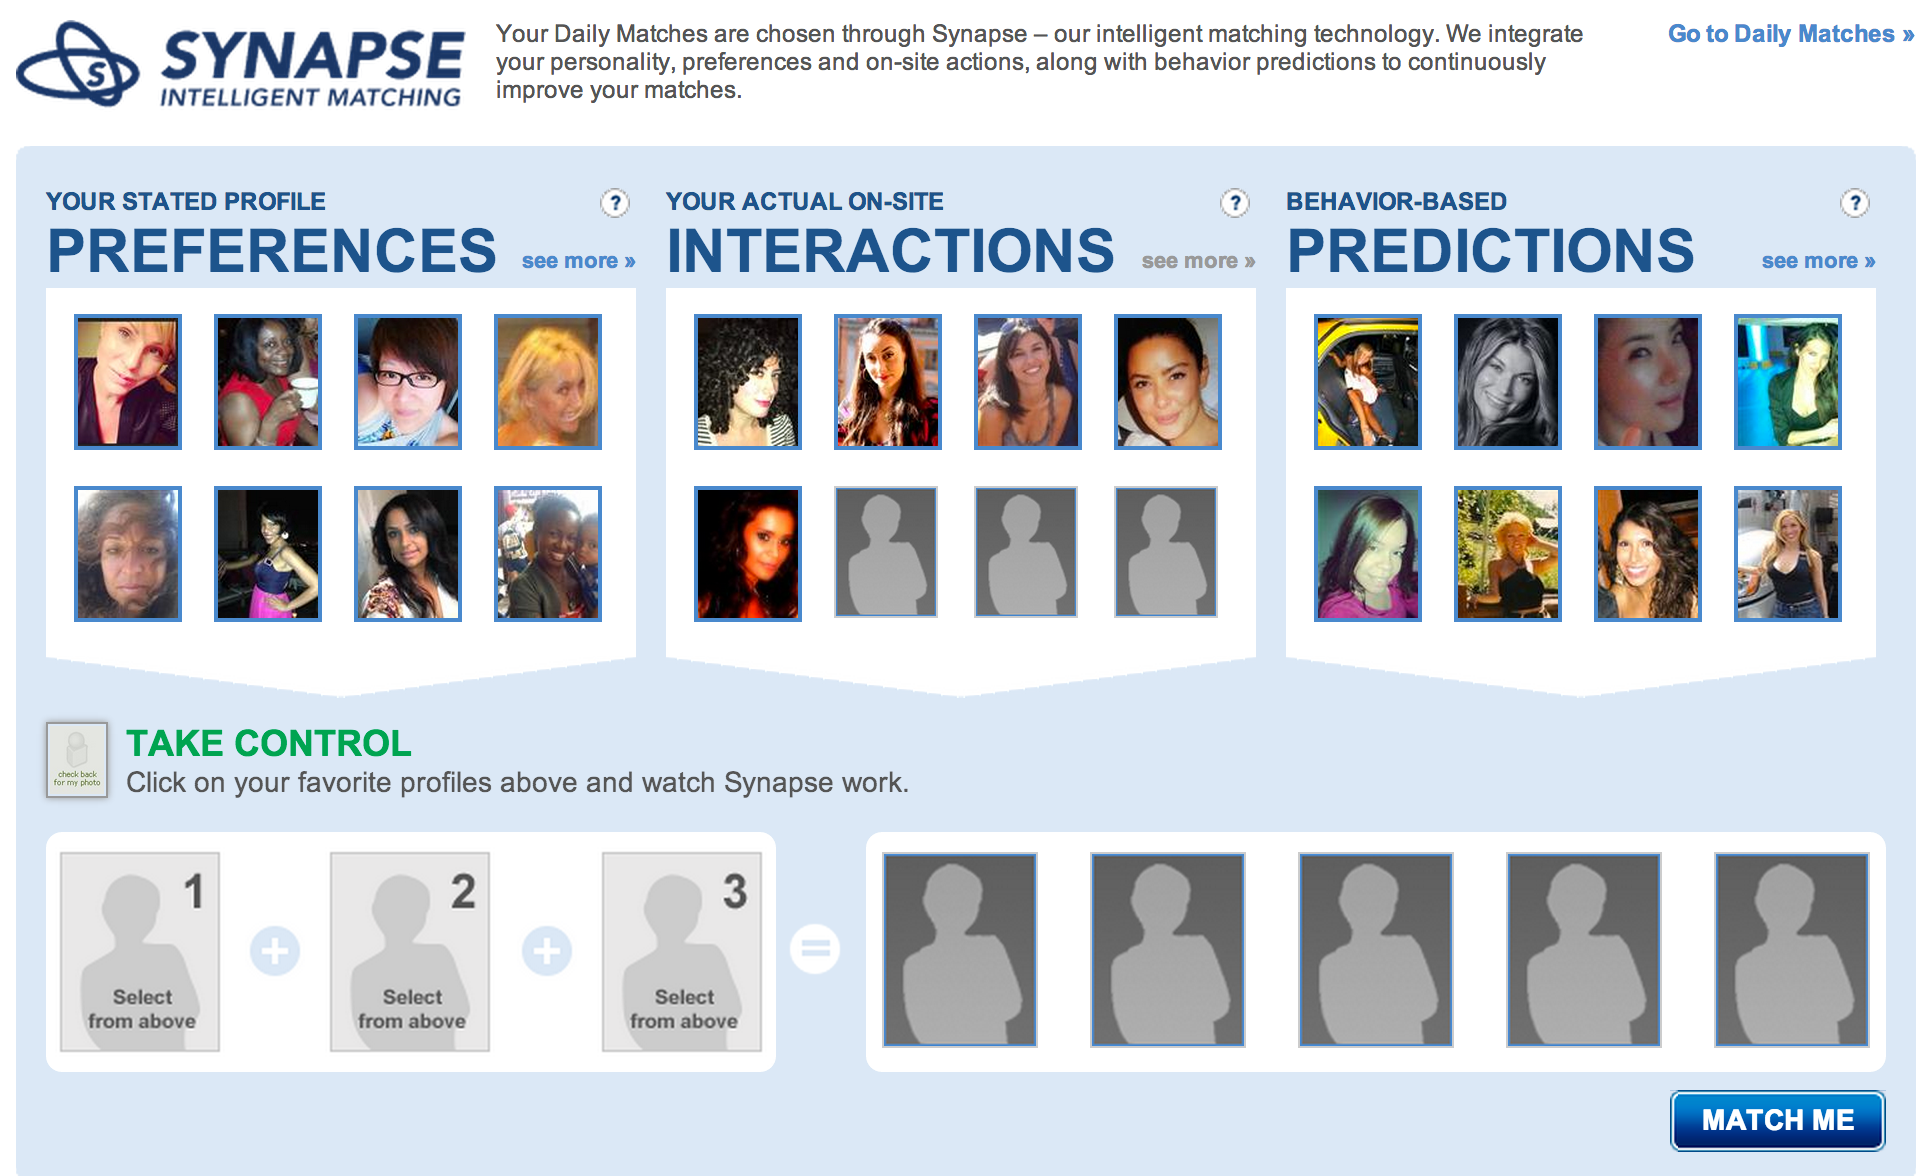
Predictive Analytics at Match.com
Some very sophisticated predictive analytics is taking place in the Online dating or hookup world.
Take for Match.com which debuted its online dating first site in the U.S. in April 1995. Today, the Match.com brand hosts sites in 25 countries, in eight different languages spanning five continents. Match.com offers an interactive way for singles to meet other singles with whom they might otherwise never cross paths. How to model and predict human attraction… Match.com is powered by Synapse algorithm.
Synapse learns about its users in a way that is similar to the way the sites like Amazon, Neflix, and Pandora to recommend new products, movies, or songs based on a user’s preferences.
Match.com uses Chemistry.com to do personalized surveys and get detailed preference data. But when it comes to matching people based on their potential love and mutual attraction, however, analytics get significantly more complex when you are attempting to predict mutual match… the person A is a potential match for person B…. but with high probability that person B is also interested in person A.
The challenge in predictive modeling in dating sites is in understanding what self-reported data is “real” in the prediction models. People have a tendency to lie (or exaggerate) about age, body type, interests etc. So excluding certain variables or taking a multi-dimensional scoring approach with different weights would be appropriate.
This space is exploding with numerous interesting companies that are attempting better matchmaking than Match.com….
- OkCupid — This dating service provides a slew of questions to mathematically match you up with a compatible date. Its “broadcast” service, which sends out a note to those in your vicinity, is an especially useful way to spend a few spare moments.
- Blendr/Grindr – The gay men-finding app Grindr has gained an impressive following of 4 million users, and its co-ed partner, Blendr, is following suit. Both allow you search the social network of nearby singles looking to connect. Good for: Casual flings but leverages the mobile location data.
- Tinder — Using Facebook to determine mutual friends, interests and location, Tinder will match with compatible users. “Like” a profile and if they like you back, you two can see more information about each other, chat and make plans. Good for: The dater who values privacy.
- eHarmony – Same as Match.com but aimed at finding true love.
- Badoo – Badoo, a London-based online service focusing on Spaniards, Italians and French by making it easier to find people nearby looking for romance. Badoo has signed up some 200 million people worldwide, 25 million of them active users.
How do these hookup sites work? Badoo subscribers sign up by posting a photo and basic personal details. Location-based technology lets them check in via smartphone to find users and see how many feet away they are at that moment. A feature called Encounters lets Badoo users flip through photos and mark them with green if they like what they see, orange if they’re not sure, and red if they’re not interested. When two people mark each other as green, Badoo contacts both and suggests they initiate a chat.
Actcive usage of “love” sites (social networks for meeting new people) is staggering. Jiayuan, the biggest dating service in China, is estimated to have 19 million active users as of September 2013 . Meetic had 16 million users, Match.com 8 million and OKCupid 2 million.(according to ComScore)
 Predictive Analytics: Coupons in Grocery Stores

Retailer accumulate huge amounts of data on a day-to-day basis. Each time, you head to Costco or Kroger (a grocery store) and fill up your cart. The cashier scans your items, then hands you a coupon – for $1.00 off your favorite brand of ice-cream. With hundreds of thousands of grocery items on the shelves, how does Kroger know what you’re most likely to buy?
Using predictive analytics and data from loyalty cards, computers in real-time are able to crunch terabytes and terabytes of your historical purchases to figure out that your favorite ice-cream was the one item missing from your shopping basket that week. Further, the computer matches your past purchase history to ongoing promotions in the store. So with your bill, you receive a coupon for the item you are most likely to buy next time.
The shift toward contextual marketing and retailing is driven by data — big data. The typical objectives are:
- Data to enable cross-channel and multi-stage marketing. 70% of buying experiences are based on how customer feels he or she is being treated. A negative experience is extremely difficult to overcome.
- Dynamic, personalized content across touch points
- Social marketing as buying cycles being online and consumers make decisions before engaging with the company (people buying from influencer’s comments and feedback)
Big changes are underway. Millenials believe that other consumers care more about their shopping experience than companies do – that’s why they share their opinions online (OECD 2013)
Predictive Analytics in Sports: ”MoneyBall” with Oakland A’s
Competitive sports is a heavy user of predictive analytics. The gap between legendary and anonymity in sports is often less than a 1% performance difference in elite sports.
Analytics in baseball was refined in 1990s by the Oakland Athletics ( (Oakland A’s) and depicted in Michael Lewis’s book Moneyball: The Art of Winning an Unfair Game and the Oscar nominated movie starring Brad Pitt. The Business Problem: the New York Yankees were the most acclaimed team in Major League Baseball. Small market teams like Oakland Athletics (Oakland A’s) had to change the way they did business. The A’s were not a wealthy team, in fact were ranked 12th (out of 14th) in payroll.
A core strategy question in sports is: How to compete with rich teams with constraints like salary caps and small market economics? How to spot and acquire low-cost undervalued talent that is a “force multipler”?
The Solution: In 1999 Billy Beane (manager for the Oakland Athletics) found a novel use of data mining. Beane hired a statistics grad to analyze baseball statistics advocated by baseball guru Bill James. Beane was able to hire excellent players undervalued by the market. A year after Beane took over, the A’s ranked 2nd!
How did they do it?
While the Yankees paid its star players tens of millions, the A’s managed to be successful with a low payroll. When signing players, they didn’t just look at basic productivity values such as RBIs, home runs, and earned-run averages. Instead, they analyzed hundreds of detailed statistics from every player and every game, attempting to predict future performance and production. Some statistics were even obtained from game footage by using video recognition techniques. This allowed the team to sign great players who may have been lesser known but were equally productive on the field.
Implications: The Oakland A’s started a trend, and the “reporting to predictive analytics” techniques began to penetrate the world of Baseball. The application of analytics to a wide variety of sports is now standard practice. It’s important to note that baseball statistics is not new. Leveraging stats to make hiring decisions is.
Historical tidbit: Dodgers General Manager Branch Rickey hired the first baseball statistician in 1947, after which the use of statistical analysis in baseball grew. But the practice took a major leap forward in 1977 when Bill James began self-publishing works about a new discipline he called sabermetrics.
Social Enterprise - connect data, insights, and people in the organization

Conversations at Scale…Conversations amplified and relevancy increased …Conversations impacting decisions and actions.
Social enterprise is the desire to get work done in new ways, work that involves other people and has Influencers as part of the process (vs. people watching the process).
Social is spawning a new creative vortex of co-creation, commerce, and collaboration the likes of which we have not see before.
Social Applications are at the heart of Social enterprise and we are seeing a gradual shift in usage as Social usage matures.
The first phase was around new and innovative collaboration capabilities such as Facebook, Twitter, Digg, Yammer or LinkedIn. In this phase, the focus was better customer engagement through Twitter or Facebook.
The second phase is enterprise social — social embedded in apps such as CRM, Sales force management, marketing Intelligence or Data Management tools to embrace a more real-time streaming, “crowdsouring” architecture.
In the third phase we are seeing the trend of business applications taking on attributes of these consumer-facing sites to develop better predictive insight. For example, better data management (structured + unstructured; inside the four walls + outside data) within a CRM system could allow operations staff to give greater context to sales forecasts that show steep drops in certain product category sales. Social data leverage brings in new capabilities so problems are identified more quickly and the resulting relevant insights can be explored.
B2C techniques are coming to B2B and B2E interactions.
Notes and References
- See also: A Very Short History of Data Science
- Sabermetrics uses statistical analysis to analyze baseball records and make determinations about player performance. James called sabermetrics “the search for objective knowledge about baseball”. Sabermetricians have questioned some basic assumptions about how talent and player contributions are judged and created quite a stir. But over time, many sabermetric ideas have found wide acceptance.
- Business value comes from consumption of data sciences or analytics, rather than the creation of analytics. Consumption – decisions and actions – is where competitive advantage is generated.
- Talent shortage — According to a McKinsey report, by 2018, there will be a shortage of 140,000 to 190,000 data scientists, and about 1.5 million managers and analysts who can use Big Data effectively to make decisions.
- About this Blog: The Business Analytics 3.0 blog covers some of today’s thorniest business problems around data strategy, technology, process, governance, and leadership.
- Data Science is increasingly becoming a catch-all buzz word that encapsulates statistics, Operational Research and Management Science. The danger is that the entire field might collapse under the weight of unrealistic expectations.
-
- linear algebra
- basic statistics
- linear and logistic regression
- data mining
- predictive modeling
- cluster analysis
- association rules
- market basket analysis
- decision trees
- time-series analysis
- forecasting machine learning
- Bayesian and Monte Carlo Statistics
- matrix operations
- sampling
- text analytics
- summarization
- classification
- primary components analysis
- experimental design
- unsupervised learning
- constrained optimization
8. Mashable lists five of the more unusual of these projects. They include:
- Homicide Watch D.C. (a precursor to the Minority Report?)
- Falling Fruit (you can find hidden outdoor edibles in urban settings, hopefully road kill isn’t included)
- Topography of Tweets (a Twitter visualization map to show you where most people are tweeting from in certain cities, because, I dunno why)
For more information: - see the Mashable article
9. Data Volume Table
| mega- | M | 1,000,000 | 2 power 20 |
| giga- | G | 1,000,000,000 | 2 power 30 |
| tera- | T | 1,000,000,000,000 | 2 power 40 |
| peta- | P | 1,000,000,000,000,000 | 2 power 50 |
| exa- | E | 1,000,000,000,000,000,000 | 2 power 60 |
| zetta- | Z | 1,000,000,000,000,000,000,000 | 2 power 70 |
| yotta- | Y | 1,000,000,000,000,000,000,000,000 | 2 power 80 |
See also:
- Making Money on Predictive Analytics: Tools, Consulting and Content
- A Very Short History of Data Science
- A Very Short History of Big Data and A Very Short History of Information Technology
- http://www.vistrails.org/index.php/Course:_Big_Data_Analysis
- Dilbert on Big Data – http://dilbert.com/strips/comic/2012-07-29/
- Apps That Know What You Want, Before You Do – New York Times
Related articles
- Canadian Tire profits with DIY predictive analytics (itworldcanada.com)
- 12 predictive analytics screw-ups (computerworld.co.nz)
- Target Practice: The Power Of Predictive Analytics (forbes.com)
- How Online Retailers Use Predictive Analytics To Improve Your Shopping Experience(blogs.sap.com)
- Avoiding Pitfalls in Predictive Analytics Models (data-informed.co
Popular Posts


Community banks, typically those with less than...

In our recent, irreverent piece, Banking AI in...